Fig. 4.
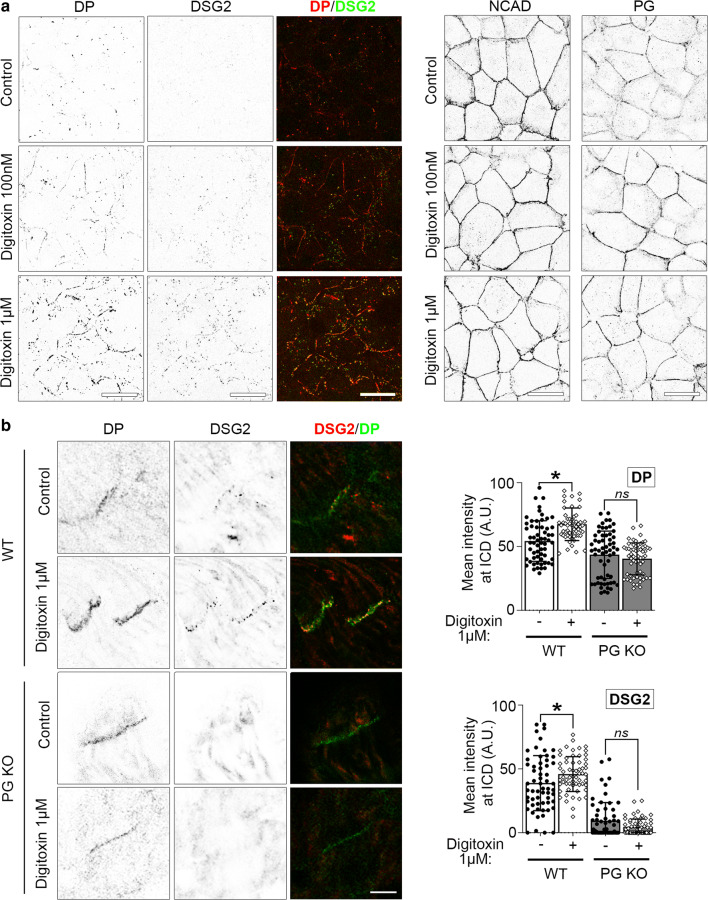
Digitoxin causes accumulation of DSG2, DP and PG at the cell–cell contacts. a Representative immunostaining images of HL-1 cardiac myocytes treated with digitoxin at indicated concentrations for 60 min and stained for DP (in merge: red), DSG2 (in merge: green), PG, or NCAD, scale bar: 20 µm. For better visibility, single channel images were inverted. N = 6 independent experiments with two dependent replicates per experiment. b Representative immunostaining images of ICDs of murine cardiac slices treated with digitoxin 1 µM for 60 min and stained for DP (in merge: green), DSG2 (in merge: red), scale bar 5 µm. For better visibility, single channel images were inverted. N = 3 mice per condition. Analysis of signal intensity of DP or DSG2 at the ICD. Every dot corresponds to one ICD, 20 ICDs per mouse measured, mean ± SD. Two-way ANOVA with Sidak’s post-hoc test. *P < 0.05, (ns)P > 0.05

