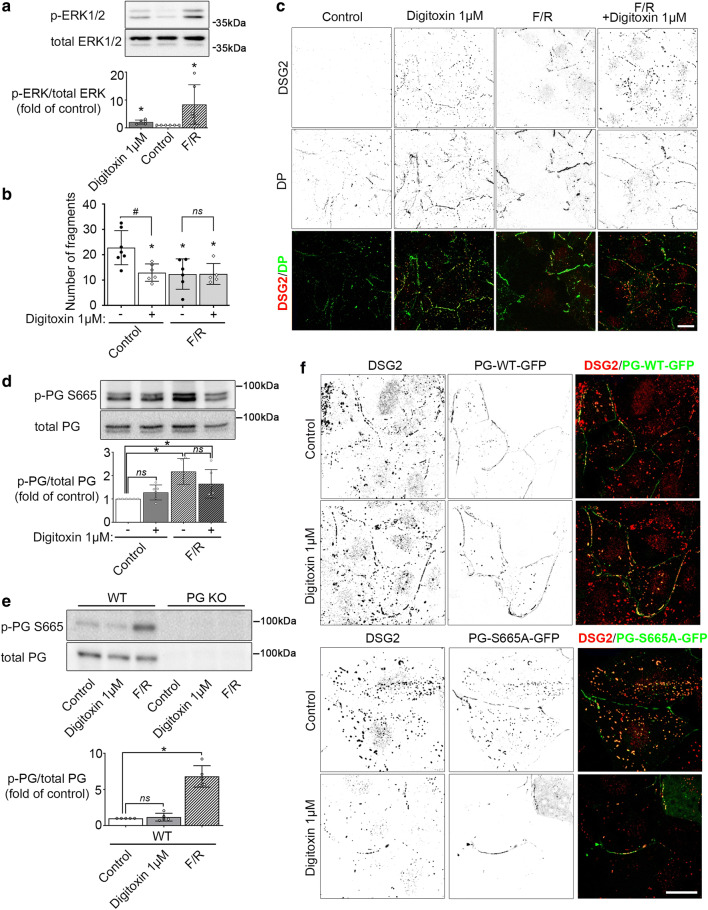
Fig. 7.
Digitoxin and adrenergic signaling induces ERK1/2 activation without additive effects. a Western blot analysis of HL-1 cells treated with digitoxin 1 µM or F/R 5 µM/10 µM for 60 min to reveal phosphorylation state of ERK1/2. Bar graphs depict the mean band intensity by densitometric quantification compared to the respective loading control as fold of control ± SD, N = 6 independent experiments. Kruskal–Wallis with Dunn’s post-hoc test. *P < 0.05 vs. control. b Dissociation assay of HL-1 cells treated with digitoxin 1 µM, FR 5 µM/10 µM or combination of both for 60 min. Bars indicate mean value ± SD. Every dot represents the mean value of two to three dependent replicates. Two-way ANOVA with Tukey’s post-hoc test, *P < 0.05 vs control, #P < 0.05, (ns)P > 0.05. N = 7 (control), 6 (digitoxin 1 µM) or 5 (F/R, F/R + digitoxin 1 µM) independent experiments, respectively. c Representative immunostaining images of DSG2 (in merge: red) and DP (in merge: green) in HL-1 cardiac myocytes treated with digitoxin 1 µM, F/R 5 µM/10 µM or combination of both for 60 min. Scale bar: 10 µm. For better visibility, single channel images were inverted. N = 4 independent experiments with two dependent replicates per experiment. Western blot analysis of HL-1 cells (d) or murine cardiac slices (e) treated with digitoxin 1 µM or F/R 5 µM/ 10 µM for 60 min to reveal phosphorylation state of PG at S665. Bar graphs depict the mean band intensity by densitometric quantification compared to the total protein as fold of control ± SD, N = 6 (control, digitoxin 1 µM, F/R + digitoxin 1 µM) or 5 (F/R) independent experiments, respectively in d. N = 5 mouse hearts per genotype in e. Kruskal–Wallis with Dunn’s post-hoc test. *P < 0.05, (ns)P > 0.05. f Representative immunostaining images of DSG2 (in merge: red) in HL-1 cardiac myocytes overexpressing GFP-tagged (in merge: green) PG phospho-deficient at S665 (PG-S665A-GFP) or wild-type PG (PG-WT-GFP) as control. Cells were treated with digitoxin 1 µM for 60 min. Scale bar: 10 µm. For better visibility, single channel images were inverted. N = 3 independent experiments with two dependent replicates per experiment

