Fig. 1.
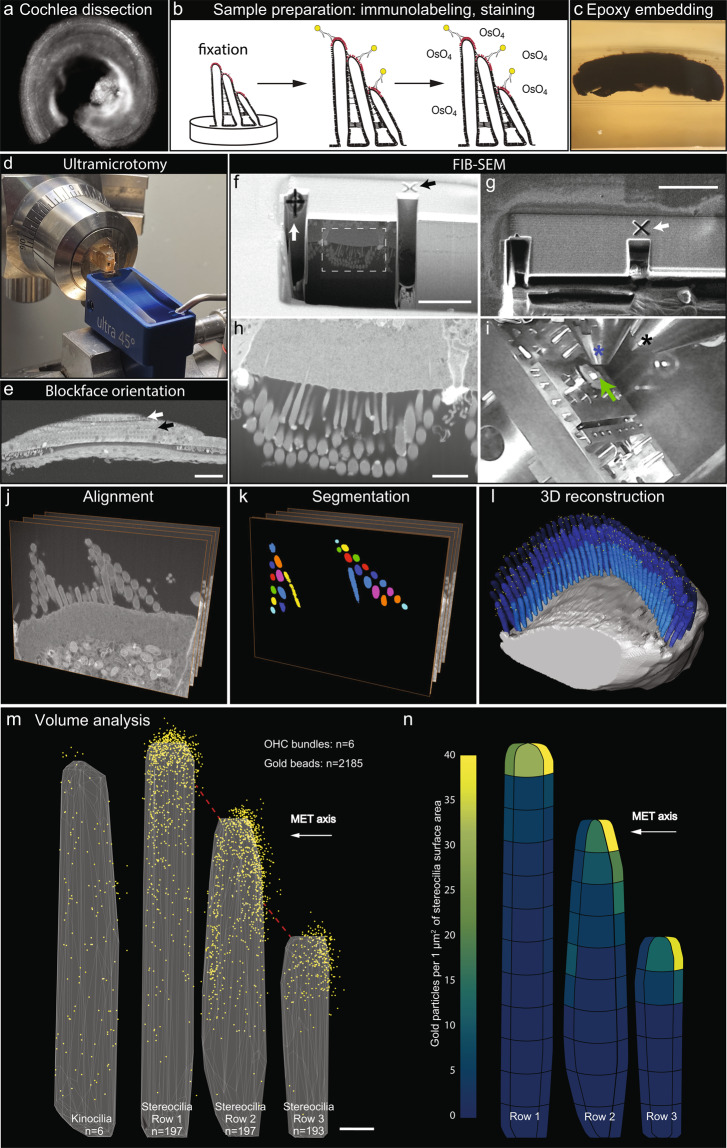
Illustration of the workflow outlining the major steps of the current study. (a) Organ of Corti dissection, tissue fixation. (b) Immunogold labeling and EM staining with heavy metals. Yellow circles were added to schematically represent gold beads. (c) Epoxy resin embedding. (d) Tissue block trimming and sectioning to approach the hair cell stereocilia bundles using ultramicrotomy. (e) Following transmission electron microscopy imaging of ultrathin sections to confirm proper tissue orientation and location within the resin block, the block was mounted for FIB-SEM, and observed with an insertable backscatter detector to identify hair cell bodies. White arrow, IHC region; black arrow, OHC region. The hair cell bodies have been partially sectioned away, with their stereocilia bundles still embedded within the resin block and pointing down, as shown in f. (f–i) FIB-SEM imaging procedure. The volume of interest was first prepared for serial imaging by placing fiducial markers and milling trenches to approach the cell, as shown in f-g. Next, the area of interest was imaged at higher magnification as shown in h. Black arrow in f points to the same fiducial marker, as the white arrow in g, used to align the ion beam milling process. White arrow in f points to the fiducial marker used to align the SEM serial imaging area outlined by white dashed lines, also shown in h. Panel i shows the microscope chamber with the sample (green arrow) mounted on the microscope stage, tilted to 52°, and brought close to the FIB source (black asterisk) and the SEM source (blue asterisk). Images f, h were acquired by the SEM beam and are at 52° tilt from the image in panel g, acquired by the ion beam. (j–l), Image processing steps: image alignment (j), stereocilia and gold bead segmentation (k), and 3D reconstruction (l) using Dragonfly and Amira software packages. (m,n), Volume analysis using a custom MATLAB algorithm allowed to generate gold bead distribution maps (m) and quantify the gold beads per stereocilia surface area (n). Panels m-n are published with permission from the original study17. Scale bars: e, 50 μm; f-g, 5 μm; h, 2 μm; m, 200 nm.

