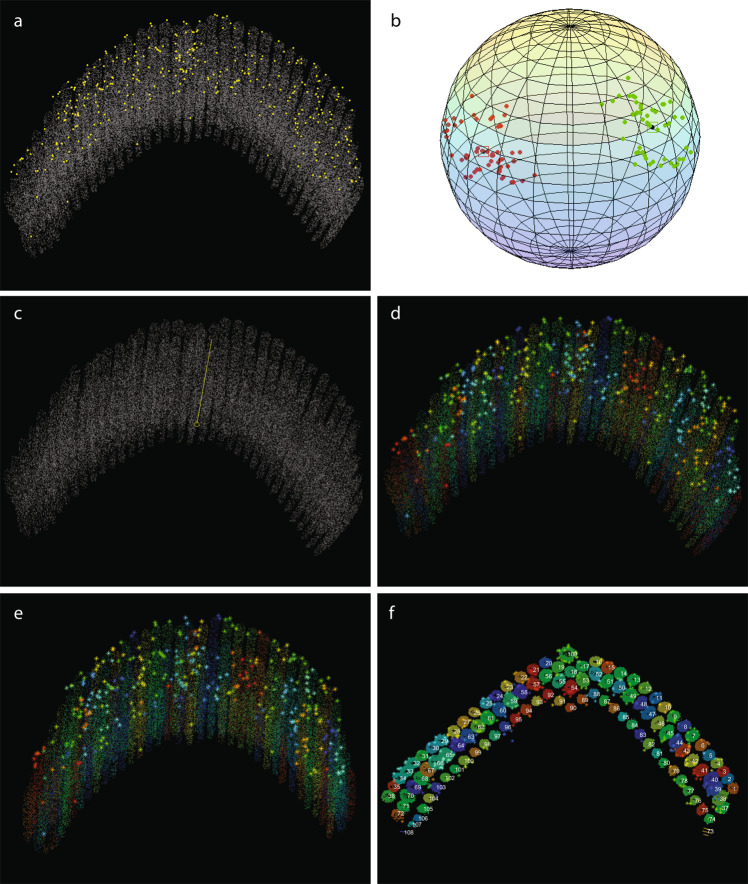
Fig. 5.
Output figures generated by the ‘towersOfGold’ script for Dataset 3 (Cell #344–50) reflecting the analysis workflow. (a) After the dataset was read and resized (optional), borders of tower masks were sampled, centroids of gold beads computed and displayed. (b) Each tower’s principal directions are computed and displayed: red and green dots represent tower directions (after a random flip); black dots (surrounded by squares) represent direction cluster centers, obtained via mean shift. (c) ‘Upward’ direction (identifying the tips of stereocilia) are determined and displayed. (d) Gold beads are associated with the towers using either ‘nearest neighbors’ or ‘distance transform’ function. (e) Towers and all associated gold beads are aligned to the upward direction, positioning all towers parallel to each other. (f) Top view of towers, along with tower IDs, after data transformation setting up the upward direction as [0 0 1], and the bottom plane set to z = 0. Same image as in Fig. 4a.

