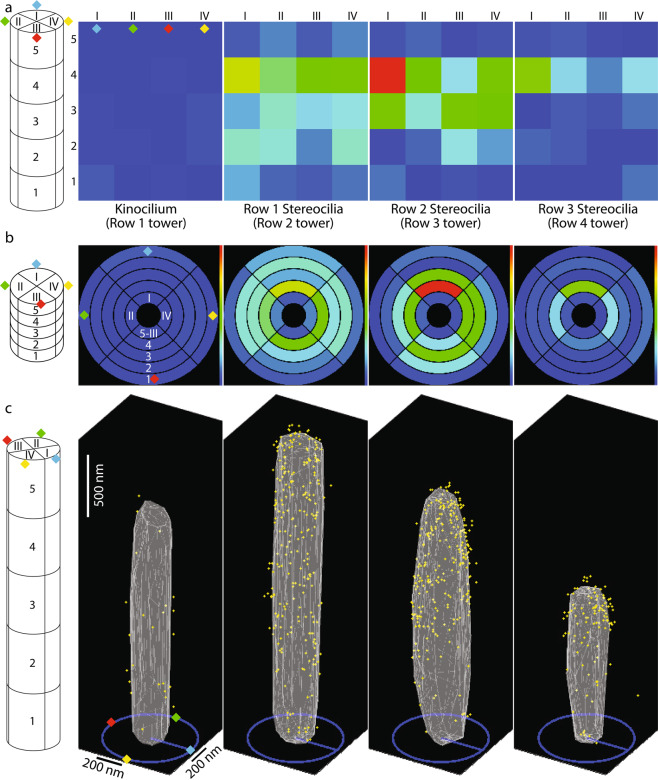
Fig. 7.
Examples of output figures generated by ‘togAggregateResults’ script. (a,b) The output figures display the gold bead distribution within a defined number of segments, which were further subdivided into a defined number of radial sectors. For this illustration, five segments along the length of stereocilia were chosen, numbered from 1 to 5 from the proximal end of stereocilia to its distal end, respectively. The most distal segment (#5 in this figure) always represents the volume above the tip of stereocilium. Each segment was further subdivided to four radial sectors (azimuth bins), numbered I, II, III and IV (blue, green, yellow and red diamonds, respectively), as shown on schematic diagrams on the left of all panels. Both panels, a and b represent the same data, and are displayed as a heat map. In a, the surface of the cylinder is represented in a ‘side view’ as a rectangle of the lateral surface of the tower. In b however, the surface of a cylinder is represented as a ‘top view’ arrangement of concentrically positioned rings, where the outermost ring is of the most proximal segment, while the innermost ring is of the area above the tip of stereocilium. (c) A 3D cumulative distribution map of gold beads. Although a specific view is shown on this panel, the actual figure generated by MATLAB is a 3D plot, and can be manually positioned at any angle. The schematic diagram on the left summarizes the actual orientation of the cilia in reference to the panels a and b using the blue, green, yellow and red diamonds. Yellow dots represent gold beads, while gray triangles represent the ‘average’ ciliary surface triangulated from the cumulative collection of surface coordinates pooled from all stereocilia analyzed.

