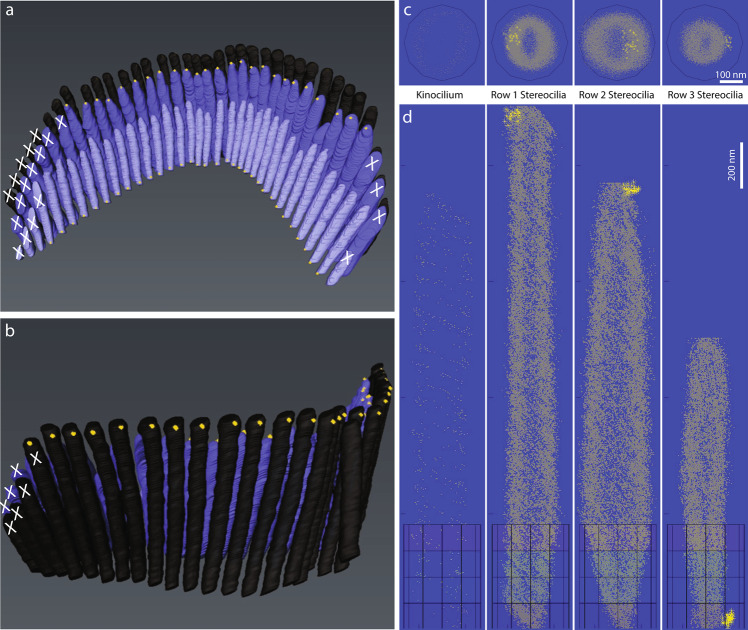
Fig. 8.
MATLAB script technical validation. (a,b) An artificial dataset with manually placed gold beads (yellow dots) was used to access the accuracy of the MATLAB analysis workflow, experimentally validating its performance. All stereocilia excluded from the analysis were labeled with white ‘X’ marks. (c,d) A 3D cumulative distribution map of manually placed gold beads generated by the MATLAB script. Top and side views (c and d, respectively) are shown for the kinocilium (left) and three rows of stereocilia. Yellow asterisks represent gold beads; gray dots represent the convex hull points of stereociliary surface. Illustrated gold beads are tightly clustered within the locations where they were intentionally placed by the authors. The choice of gold bead placement location was unique for each row of stereocilia to control for potential errors of data processing such as stereocilia orientation, azimuth correction, or placement within the rows during MATLAB analysis. No beads were placed on the surface of the kinocilium.

