Figure 1.
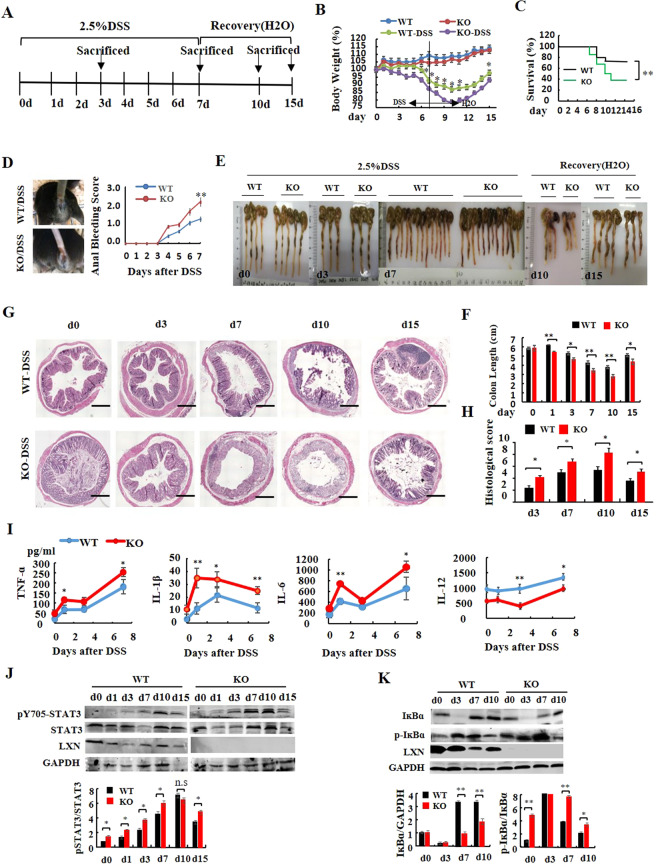
LXN deficiency accelerates DSS-induced colitis in mice. (A) Experimental protocol for the induction of the acute colitis model in LXN−/− (KO) and littermate LXN+/+ (WT) mice. (B) Changes in body weight of WT and KO mice (relative to starting weight, set as 100%) is shown (n = 16). (C) Kaplan–Meier survival plot of WT and KO mice after induction with 2.5% DSS. (D) Anal bleeding is photograph and bleeding score is shown (n = 16). (E) The gross morphology of shortened colon was photograph. (F) The colon length was measured at the time point as indicated (n = 6). (G,H) Representative images of H&E-stained colons from WT and KO mice treated or untreated with DSS for different days are shown. Scale bars = 100 μm. The histological score of WT and LXN KO mice during DSS-mediated colitis at day 3, day 7, day10 and day15 are shown (G). (I) Data represent levels of cytokines indicated in serum from WT and KO mice treated with DSS for different days (n = 6). (J,K) Protein levels of LXN, STAT3, p-STAT3 (J), IĸBα and p-IĸBα (K) are detected in colon tissue from WT and KO mice after induction with 2.5% DSS. The results shown are the mean ± SEM. The survival curve is analyzed by using the long-rank test, other data was evaluated using the two-tailed unpaired t-test. Data are representative of three independent experiments. *p < 0.05; **p < 0.01; n.s, no significant.

