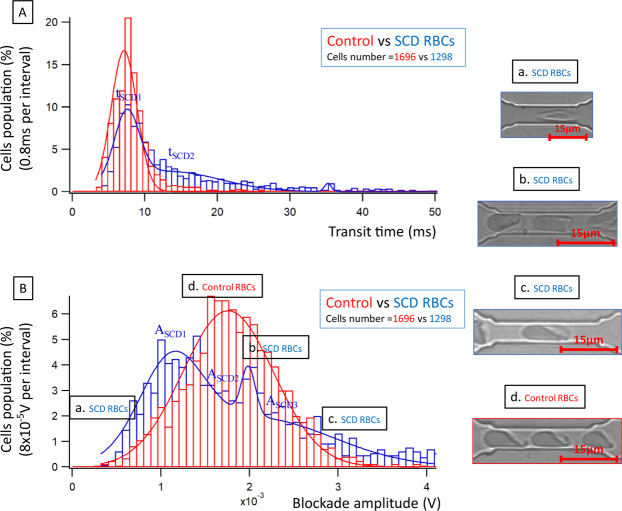
Figure 3.
(A) Comparison of average transit time of control and SCD RBCs. For SCD RBCs, the transit time is more dispersed with a longer transit time for a part of the cell population; (B) Comparison of average blockade amplitude of control and SCD RBCs. Three main populations are observed when examining the blockade amplitude (Supplementary Table S3). The transit time resolution is 0.8 ms and the blockade amplitude resolution is 8 × 10⁻⁵ V. On these graphs data was collected from 1696 control RBCs coming from 6 healthy donors, and 1298 SCD RBCs coming from 5 patients. Images a, b and c (graph B) correspond to subpopulations of SCD RBCs, while image d corresponds to control RBCs.

