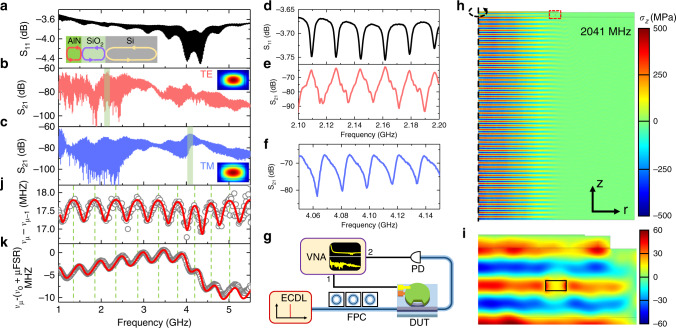
Fig. 2. Microwave frequency electro-acousto-optic modulation.
a Electromechanical S11 spectrum from 1 to 5.5 GHz. A range of equidistant bulk acoustic resonances is found to exist over a broad frequency range. The inset schematic illustrates the acoustic wave reflection at interfaces. b, c Optomechanical S21 responses of TE and TM modes demonstrate acousto-optic modulation covering multiple octave-spanning microwave frequencies. Due to different optical mode shapes (insets in b and c) and thus acousto-optic mode overlap, TE and TM modes show dissimilar S21 spectra. d, e The zoom-in of S11 and TE mode’s S21 within the window (green shaded area in b) around 2 GHz. f The zoom-in of TM mode’s S21 around 4 GHz in c. The resonances distribute evenly with an FSR of 17.5 MHz. g Schematic of the setup for measuring electromechanical and optomechanical response. DUT device under test, ECDL external cavity diode laser, FPC fiber polarization controller, PD photo-diode, VNA vector network analyzer. h Numerical simulation of vertical stress σz distribution for one typical acoustic resonant mode at 2.041 GHz under 1 V driving field, with a zoom-in around the optical waveguide (red box in h) shown in i. At several GHz, the acoustic wavelength is similar in scale to optical wavelength and waveguide structure. j The measured (circle) and calculated (solid line) frequency difference between each pair of adjacent Si resonances, showing a periodic variation of local FSR around an average value of 17.5 MHz. The maxima of FSR align with the SiO2 resonances marked by green dashed lines. k Measured (circle) and calculated (solid line) higher order dispersion represented by the frequency deviation from an equidistant frequency grid (with average FSR = 17.515 MHz), referencing to mode ν0 (3.0145 GHz). μ is the mode number difference relative to the mode at 3.0145 GHz.

