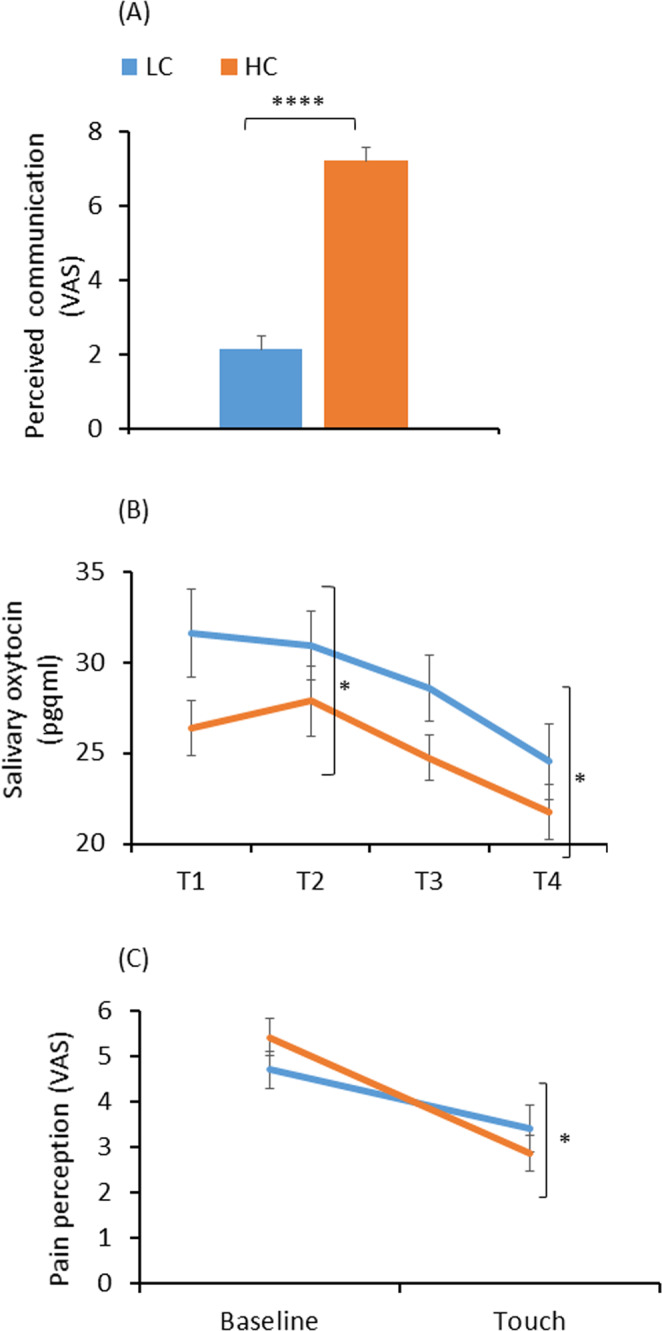
Figure 8.

Differences between low communicators (LC) and high communicators (HC). (A) perceived ability to communicate with PARO (****p < 0.0001); (B) oxytocin levels. Significant difference at T1 and T3 (*p < 0.05); (C) Strong-pain ratings. The decrease in pain ratings from Baseline to Touch condition was greater in HC compared to LC (*p < 0.05). Values denote mean visual analogue scale (VAS; 0–10) (A,C) and mean salivary oxytocin (pg/ml) (B) ±SEM. T1 – upon arrival; T2 – following the first pain-perception measurements; T3 – following 10 mins of either reading or interacting with PARO; T4 – completed while touching PARO (in the PARO group only), following the third, and last, pain-perception measurements.
