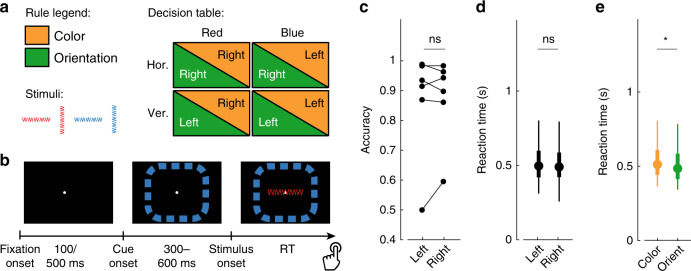
Fig. 1. Task and behavioral performance.
a Stimuli and decision table showing the correct button press for each combination of rule and stimulus characteristics; b task sequence and screen layout; c task performance for left and right button presses. Each line connecting two dots represents one subject; d reaction time distributions for left (N = 1559) and right (N = 1566) button presses of all subjects combined (see Supplementary Fig. 2 for individual subjects); e reaction time distributions for the color (N = 1578) and orientation (N = 1547) rules. The boxplots in d and e show the 5, 25, 50 (filled circles), 75, and 95% boundaries. Gray horizontal bars represent the outcome of two-sided statistical tests of difference, using a paired t-test in c and Student’s t-test in d and e. ns means not significant and * indicates significance at α = 0.01. Orange: color rule; green: orientation rule. a and b were adapted from ref. 30.

