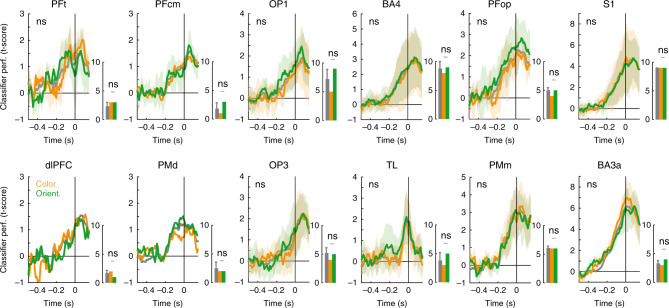
Fig. 3. Decisions for color and orientation rules invoke similar responses in the same brain regions.
The left panels show the average classifier performance traces (± standard deviation, numbers of data points included are given in the right panels) for classifiers trained on only color rule trials (orange), only orientation rule trials (green), and the average of ten subsampled trial sets that included both color and orientation rules, and match the trial count of one rule (gray). All brain regions that showed significant left/right decoding based on all trials are included here. For all regions with three or more decoding leads for both the color and orientation only classifiers, a cluster-based permutation test was performed to compare decoding performance of color and orientation over time. None of the clusters survived FDR correction. The right panels show the number of leads that show significant decoding for each of the classifiers. For the subsampled classifier bars show the mean, and error bars indicate the standard deviation across ten repetitions (raw data can be found in Supplementary Table 5). Horizontal bars indicate a one-sided Wilcoxon rank test of the difference between the number of leads for color and orientation rule compared to pairs of randomly subsampled classifiers (α = 0.05; FDR corrected); ns is not significant. The total number of leads per brain area can be found in Supplementary Fig. 3b.

