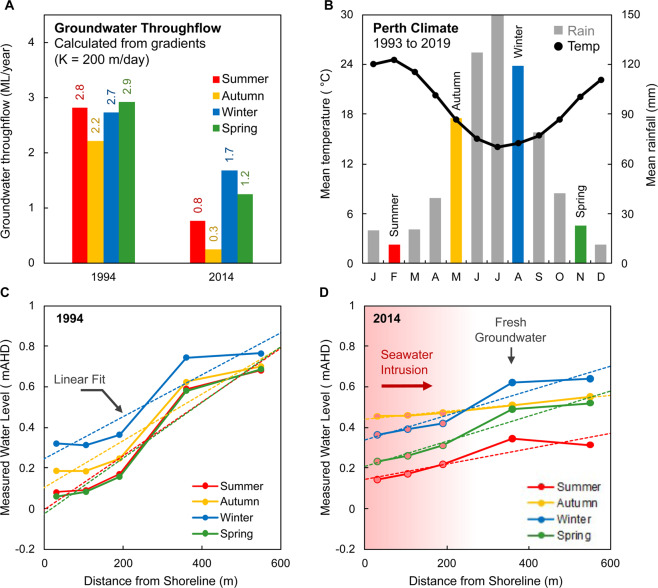
Figure 15.
Set of charts showing seasonal variations in groundwater levels, climate and estimated throughflow at Quinns Rocks. Panel A shows the groundwater throughflow, Q, calculated from hydraulic gradients using hydraulic conductivity K = 200 m/day. Gradients are computed from the raw measured water levels188. Panel B shows the mean seasonal temperature and rainfall between 1993 and 2019. Panels C,D show the average seasonal groundwater levels measured in the SIM wells along with estimated linear fits for 1994 and 2014 respectively. The average groundwater throughflow during 1994 is significantly higher than in 2014, however we must acknowledge that there are significant uncertainties in the inputs to estimates of hydraulic gradient and calculation of groundwater throughflow (see also Part 1.3, 3.2, and Fig. 14). At best these methods provide a first-order approximation of groundwater flow.

