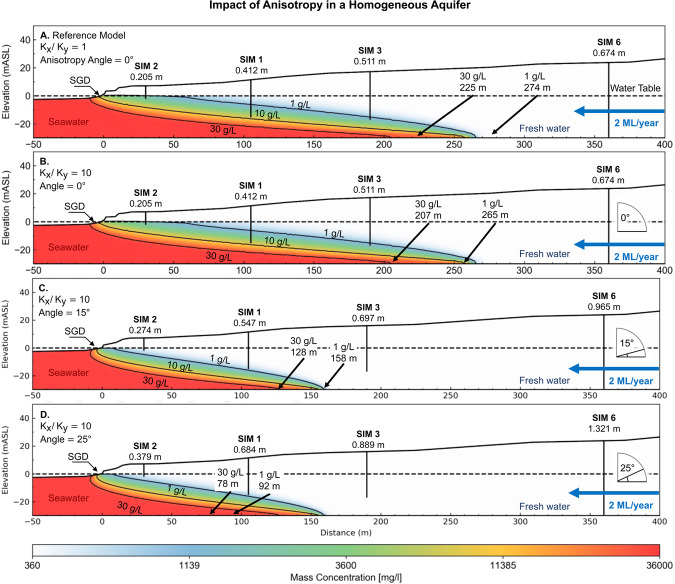
Figure 20.
Images showing the influence of increasing anisotropic angle on the seawater wedge geometry in a high hydraulic conductivity (200 m/day) homogeneous aquifer. In this example, the angles of anisotropy are 0° (B), 15° (C), and 25° (D) degrees for a constant anisotropic ratio Kx/Ky = 10. Panels A and B compare the isotropic and anisotropic models. The increasing angle of anisotropy is associated with higher hydraulic heads (annotated below each well), which is likely to be the primary driver behind the seaward movement of the seawater interface. The seawater wedge geometry in Panel D resembles the seawater interface geometry for a homogeneous isotropic model with a groundwater throughflow rate of 4 ML/year (see Fig. 15). This demonstrates that knowing the position of the wedge toe is not a reliable indicator of throughflow and vice versa.

