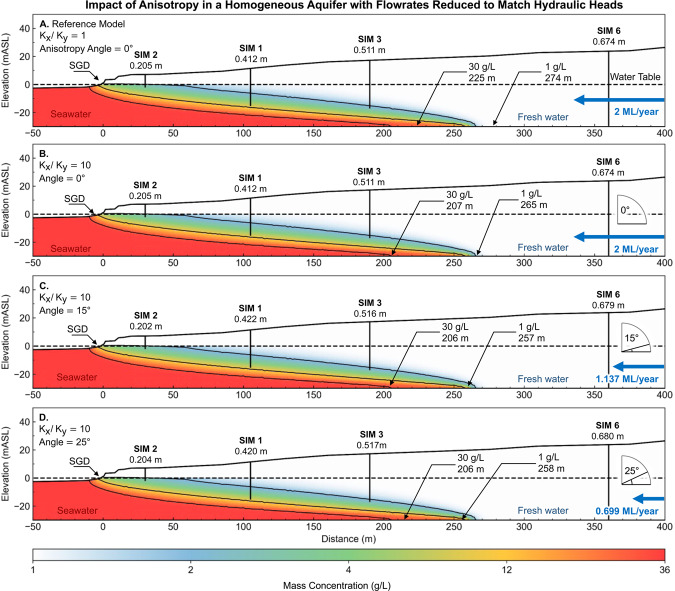
Figure 21.
Images showing the influence of anisotropy on the seawater wedge geometry after reducing groundwater throughflow to match hydraulic heads. The differences between the resulting seawater wedge geometry is minor. For example, the wedge geometry from the lowest flowrate (0.69 ML/year) with anisotropic angle of 25° (Panel D) is similar to the wedge geometry at high 2 ML/year with an angle of 0° (Panel A). Lower anisotropic angles result in a wider zone of submarine groundwater discharge. This figure highlights the fact that knowing the seawater wedge position alone is not an indicator for groundwater throughflow. There is a clear need for better constraints on hydraulic parameters to understand the seawater interface in these coastal aquifers.

