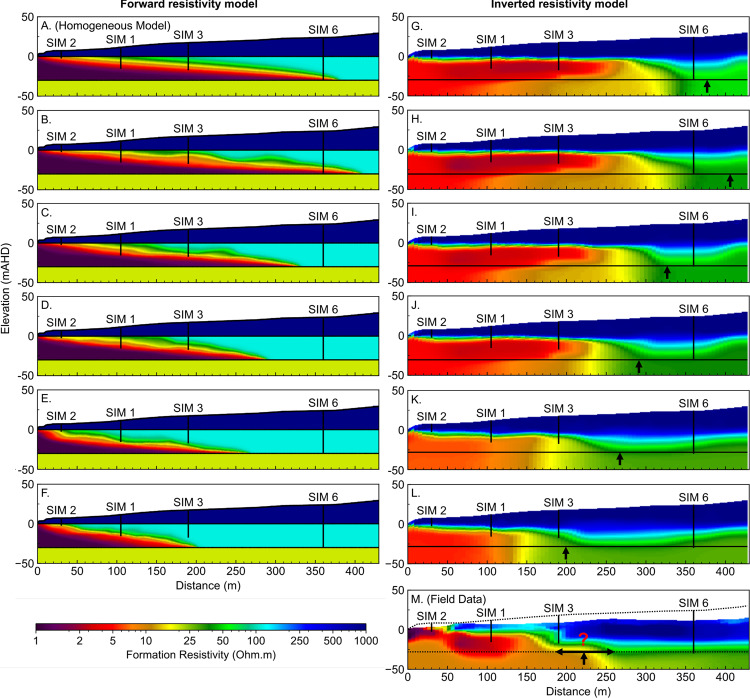
Figure 23.
Images showing the inverted resistivity distributions compared to the forward resistivity distributions for a range of hydraulic conductivity models. Panel A shows the forward resistivity distribution for a homogeneous model with 150 m/day hydraulic conductivity (e.g. Fig. 22G). Panels B through F show the forward resistivity model based on the solute distribution for each of the randomly generated hydraulic conductivity distributions (e.g. Fig. 22H through L). Panels G through L show the inverted resistivity outcomes of the synthetic models. Panel M shows the inverted resistivity distribution from field ERI data near to the Quinns Rocks reference, including the approximate projected locations of the SIM wells and topography (dashed line). The inversion outcomes from the synthetic data show the approximate location of the seawater toe and the depth of the substrate can be recovered. However, definition of the mixing zone and the wedge geometry is ambiguous and could be easily misinterpreted.

