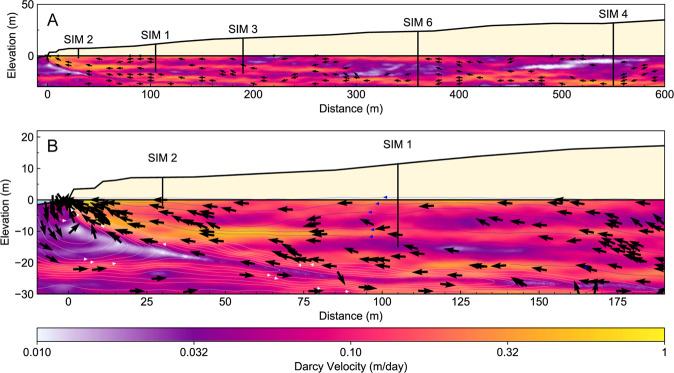
Figure 25.
Images showing the Darcy velocity distribution for a complex hydraulic conductivity model (see Fig. 22F). The distribution of arrows is weighted by the magnitude of the y-component. Panel A shows the full width of the model including zones of relatively high and low velocities related to the hydraulic conductivity distribution. Panel B show a zoomed in section of Darcy velocity proximal to the seawater wedge. It highlights the extremely slow groundwater velocity in the seawater recirculation cell and the complex flow directions related to hydraulic conductivity distribution in the zone of fresh terrestrial groundwater above the wedge. The screened intervals in the monitoring wells may be in high-velocity conduits or low-velocity pockets that may result in higher or lower inter-well hydraulic conductivity gradients. A distributed velocity measurement along the length of the well may identify these zones and improve calibration needed for solute transport modelling along coastal margins.

