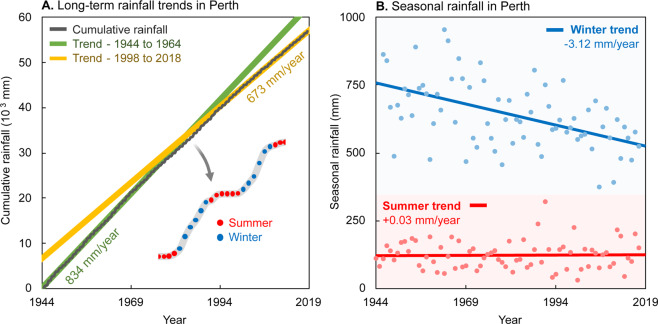
Figure 8.
Graphs showing long-term trends in winter and summer rainfall in Perth, Western Australia. Panel A shows the cumulative rainfall from 1944 to 2018. The average rainfall over the entire period is approximately 700 mm/year. Analysis of 20-year trends indicate that an approximately 25% reduction in rainfall has occurred since the start of measurement in 1944. The average rainfall from 1944 to 1964 was 834 mm/year, compared to data from 1998 to 2018 with an average rainfall of 673 mm/year. Panel B shows the total seasonal rainfall for summer and winter showing that a clear decrease in winter rainfall. The decreasing winter rainfall is strong motivation for understanding the follow-on effects to the seawater interface.

