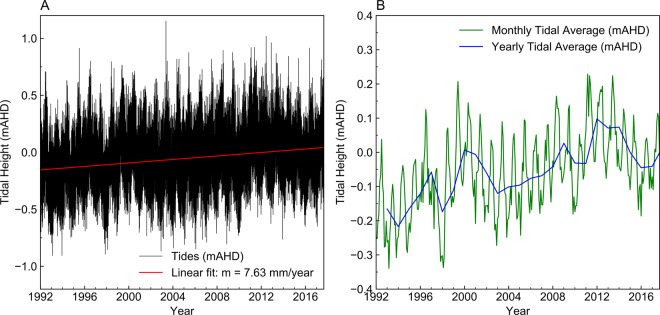
Figure 9.
Charts showing tidal measurements from a monitoring location near the reference site in meters Australian height datum, mAHD. Panel A shows the raw hourly data since 1992 with a linear fit overlaid. Panel B shows the monthly and yearly averages of the raw data. Tidal levels have risen by approximately 7.63 mm/year since monitoring began. The estimate for sea-level rise that also considers global meteorological events is 9.0 mm/year98. The rise in sea level over the monitoring period is a potential factor for landward movement of the seawater interface at the reference site.

