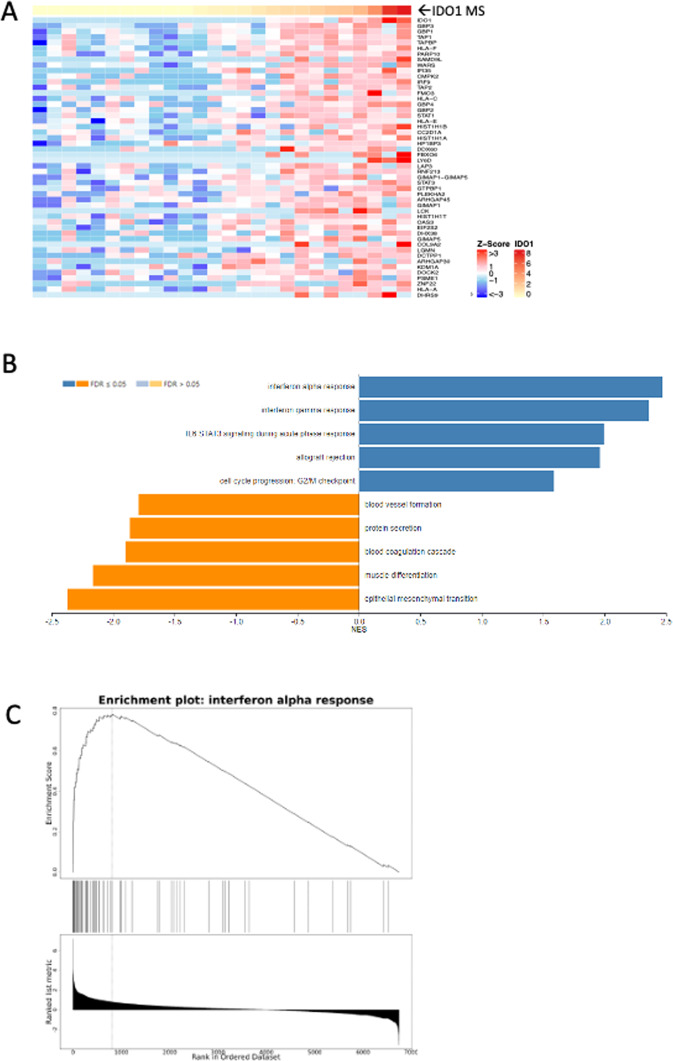
Figure 4.
Global proteotype associated with high IDO1 abundance in 26 sample NSCLC subcohort. (A) Highest abundance proteins in NSCLC global analyses as a function of IDO1 MS protein level. (B) Significantly enriched Hallmark 50 pathways associated with IDO1 MS protein level by GSEA. (C) Enrichment plot for interferon alpha response depicting enrichment score (upper panel) versus ranked abundance (lower panel) for all pathway proteins quantified in the global dataset.

