
Figure 2.
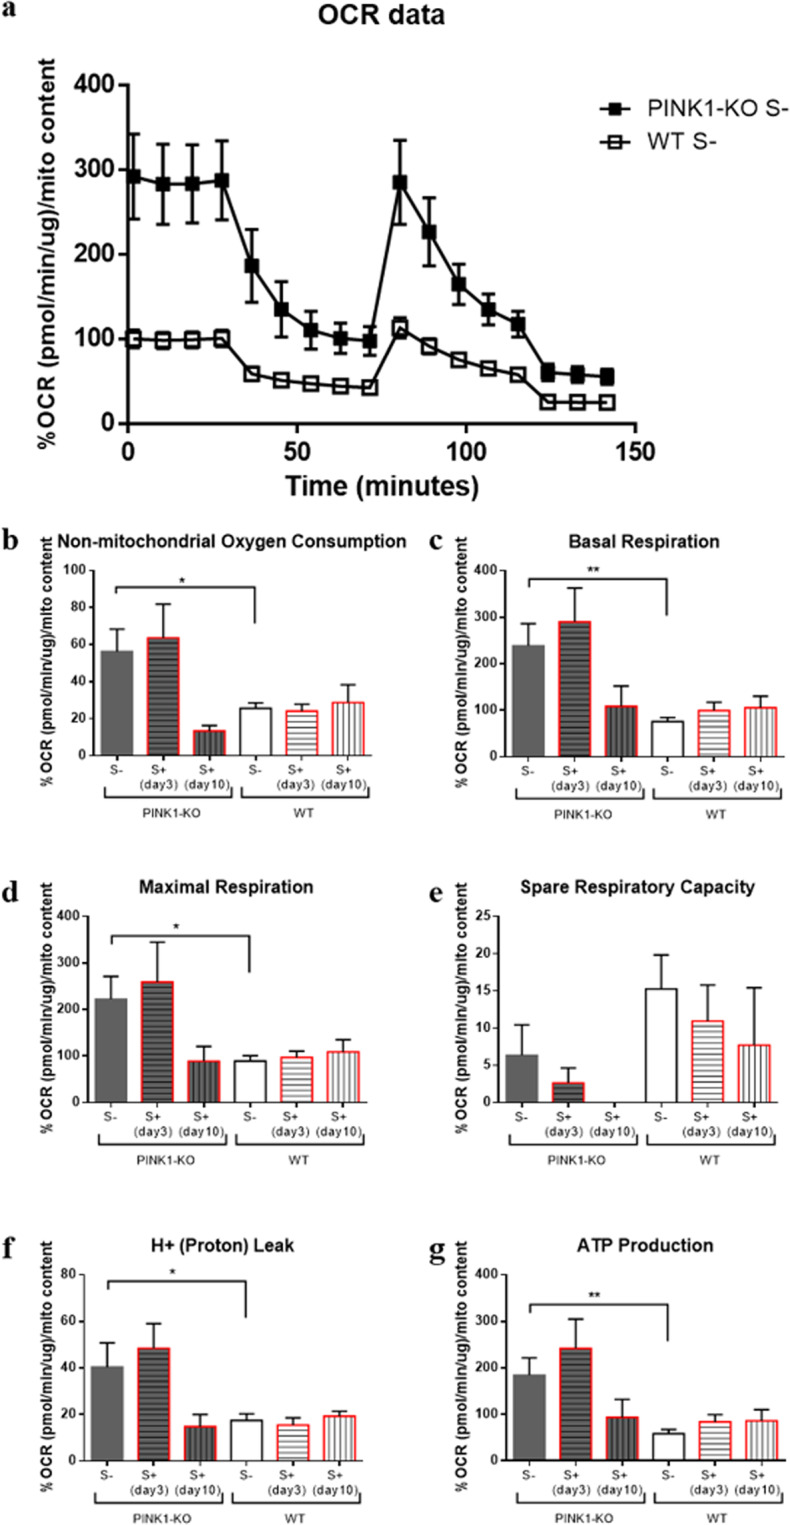
PBMCs show twofold increase in OXPHOS relative to WT-PBMCs. (a) OCR data normalized to mitochondrial content for PBMCs derived from unstressed PINK1-KO and WT rats, (b) non-mitochondrial oxygen consumption, (c) basal respiration, (d) maximal respiration, (e) spare respiratory capacity, (f) H+ (proton) leak, (g) ATP production as measured by an XF metabolic bioanalyzer. For each OXPHOS assay, the following compounds were used at the following final concentrations in cells: 1 µM Oligomycin, 1.5 µM carbonyl cyanide 4-(trifluoromethoxy)phenylhydrazone (FCCP), 1 µM Antimycin, 100 nM Rotenone. For control groups (S-), n = 14–15 (5 females and 9–10 males per group) for stressed groups (S+) sacrificed in day 3 the n = 10 (5 females and 5 males per group) and in day 10 the n = 4–5 males per group. OCRs data are expressed as percent means ± SEM relative to time 0 of WT S- group for each cohort/experimental group and normalized to total protein content and mitochondrial content by densitometric analysis of TOM20 levels; *p ≤ 0.05,**p ≤ 0.01, ***p ≤ 0.001, ****p ≤ 0.0001, two-tailed Student’s t-test.