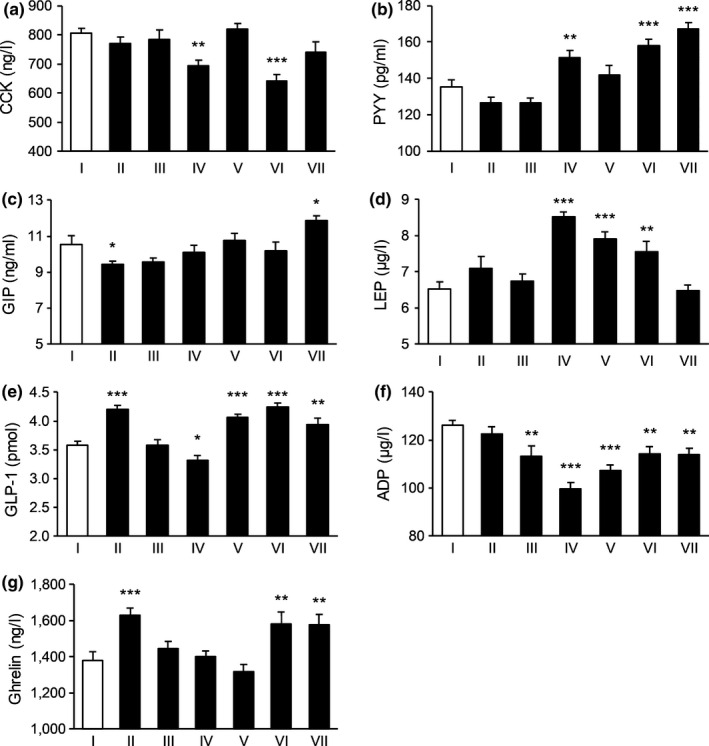
FIGURE 3.

The effect of tested substances in regulating satiety signals in the third day. (a) The effect on the level of CCK; (b) the effect on the level of PYY; (c) the effect on the level of GIP; (d) the effect of the level of LEP; (e) the effect on the level of GLP‐1; (f) the effect on the level of ADP; and (g) the effect on the level of Ghrelin. N = 15 per each group. *p < .05, **p < .01, ***p < .001 versus control. I: Blank control, II: Potato extract PI2, III: Competing goods, IV: VW‐VM‐B, V: VW‐VM‐A, VI: VW‐VM‐A/L, and VII: VW‐VM‐A/H
