FIGURE 5.

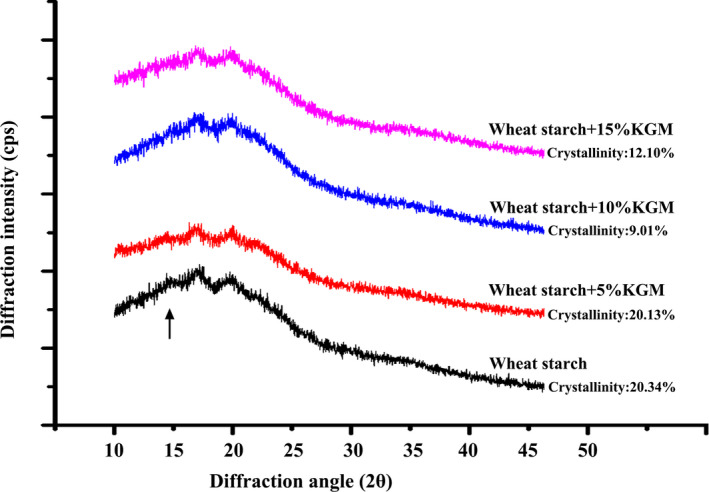
X‐ray diffractometry of freeze‐dried wheat starch samples. The arrow indicates the gradually disappeared crystalline diffraction peak at 15°

X‐ray diffractometry of freeze‐dried wheat starch samples. The arrow indicates the gradually disappeared crystalline diffraction peak at 15°