
FIGURE 2.
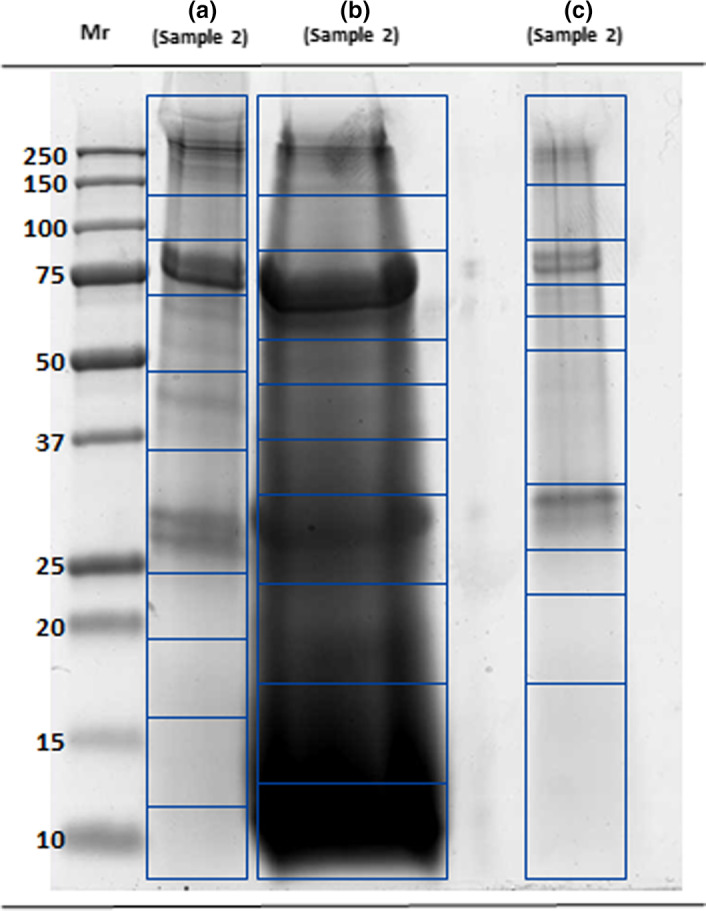
SDS‐PAGE separation of the precipitate (track a), supernatant (track b) obtained by aqueous fractionation versus the protein fraction obtained by Folch extraction (track c). Each lane has been cut into 10 segments, the proteins digested and sent to MS analysis. Mr: molecular mass ladder. Staining with Bio‐Safe Coomassie blue