FIGURE 3.

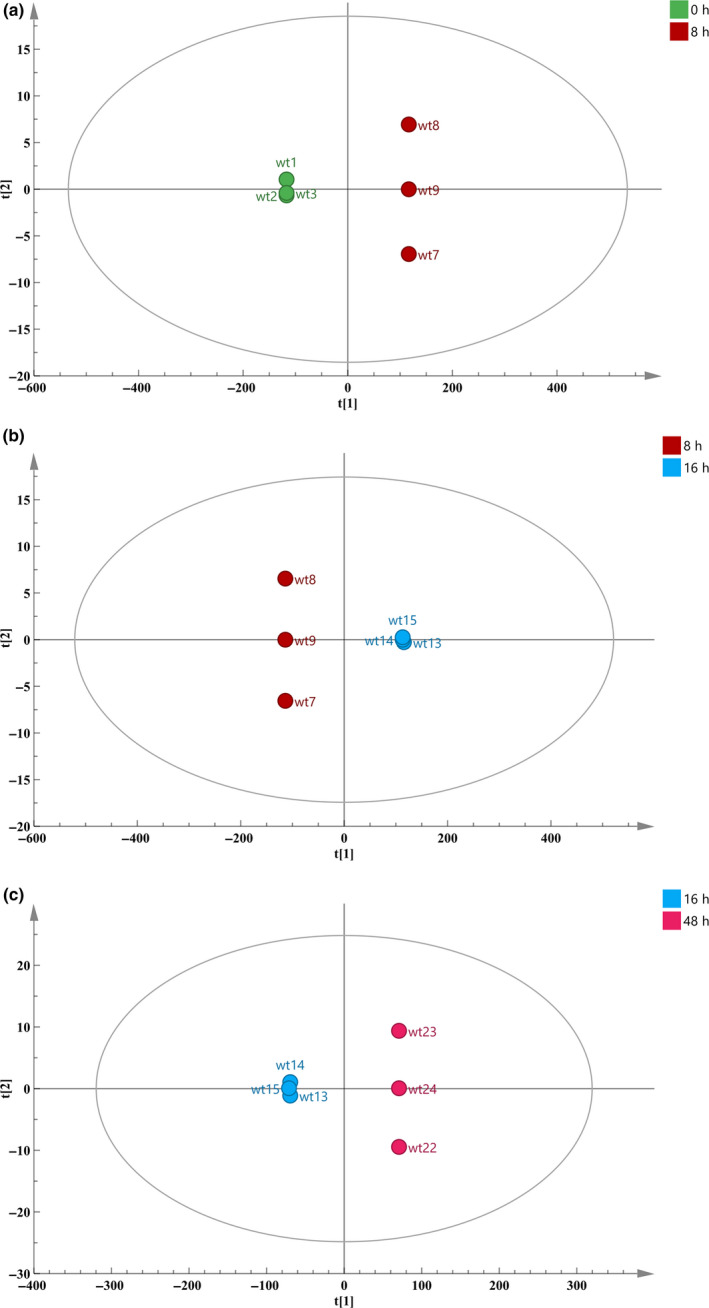
OPLS‐DA diagram of different fermentation time. a: 0 and 8 hr; b: 8 and 16 hr; c: 16 and 48 hr. The larger the distance between the two times, the greater the difference between the metabolites in their CFS

OPLS‐DA diagram of different fermentation time. a: 0 and 8 hr; b: 8 and 16 hr; c: 16 and 48 hr. The larger the distance between the two times, the greater the difference between the metabolites in their CFS