FIGURE 6.

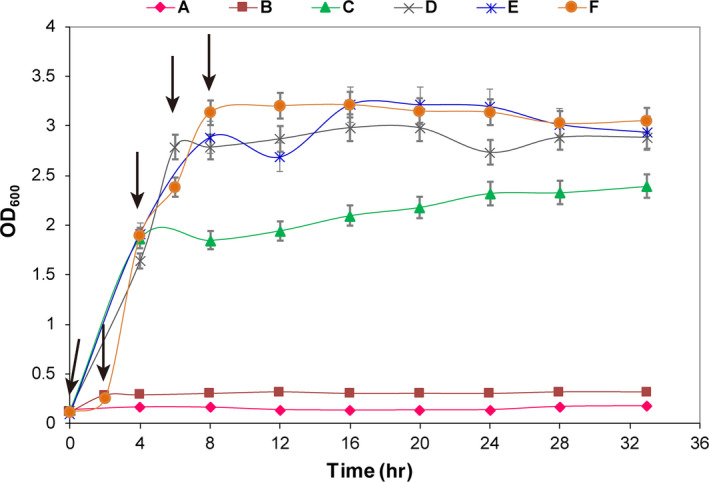
Effect of CFS on the growth curve of E. coli. CFS. A 2 ml CFS was concentrated 15 times and was added at 0, 2, 4, 6, or 8 hr; the black arrow represents the time when CFS was added (A: 0 hr, B: 2 hr, C: 4 hr, D: 6 hr, E: 8 hr, F: control)

Effect of CFS on the growth curve of E. coli. CFS. A 2 ml CFS was concentrated 15 times and was added at 0, 2, 4, 6, or 8 hr; the black arrow represents the time when CFS was added (A: 0 hr, B: 2 hr, C: 4 hr, D: 6 hr, E: 8 hr, F: control)