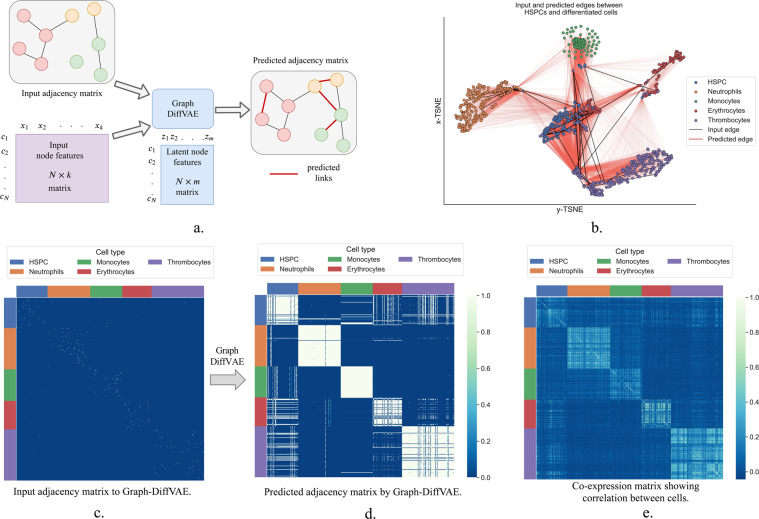
Figure 4.
Methodology proposed for analyzing links between cells. (a) Graph-DiffVAE uses an initial adjacency matrix and individual node features to predict more links between cells. (b) Projection of cells onto 2-dimensional t-SNE embedding of the latent node features learnt by Graph-DiffVAE and illustration of initial and predicted links between HSPCs and differentiated cells. (c) Adjacency matrix with input links between cells (the colour white indicates an input edge); each cell is connected to the highest positively correlated cell. (d) Adjacency matrix with predicted links between all cells by Graph-DiffVAE (the colour white indicates a predicted edge). (e) Co-expression matrix between all cells; each entry represents the absolute value of the Pearson correlation coefficient.

