Fig. 1.
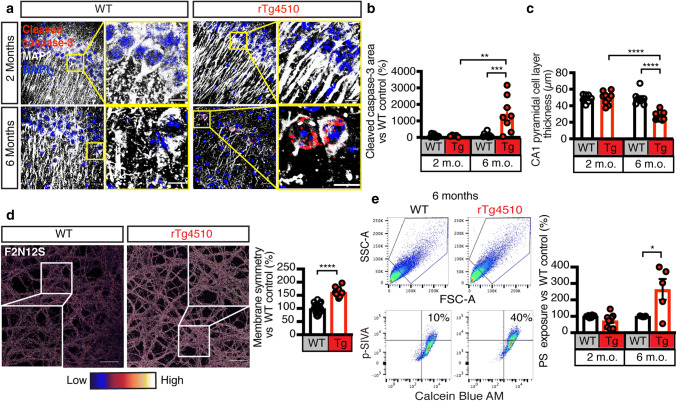
Increased apoptotic hallmarks cleaved caspase-3 and phosphatidylserine exposure in rTg4510 mice. a–c Maximum intensity z-projection images of the hippocampus of 2 and 6 month-old rTg4510 and WT mice probed with the apoptosis marker Cleaved caspase-3 (red), the neuronal marker MAP2 (white) and the nuclear marker DAPI (blue). Quantification of the images reveals a massive increase in neuronal apoptosis and cell loss in rTg4510 mice at 6 months. Scale bars: 20 μm. d Representative images and quantification of WT and rTg4510 primary neurons labeled with the membrane asymmetry probe F2N12S. A higher ratio (pseudo-colored as low-blue to high-white) indicates more membrane symmetry and correlates with the exposure of negatively charged phospholipids including PS on the surface. This provides evidence that there is more PS exposure in rTg4510 neurons. Inset is zoomed-in image of white framed region. Scale bars: 10 μm. e Representative plots and quantification of the flow cytometry analysis of apoptotic PS exposure (p-SIVA+) on viable (Calcein Blue AM+) synaptosomes obtained from 2 and 6 month-old WT and rTg4510 mice. This analysis indicates that when comparing equal fractions of viable synaptosomes, there is a greater proportion of apoptotic synaptosomes in rTg4510 than WT mice. Unpaired t test within the same age group. Data are presented as mean ± SEM, *p < 0.05, **p < 0.01, ***p < 0.001, ****p < 0.0001; b, c two-way ANOVA with Tukey’s multiple comparison test, e, f unpaired t test

