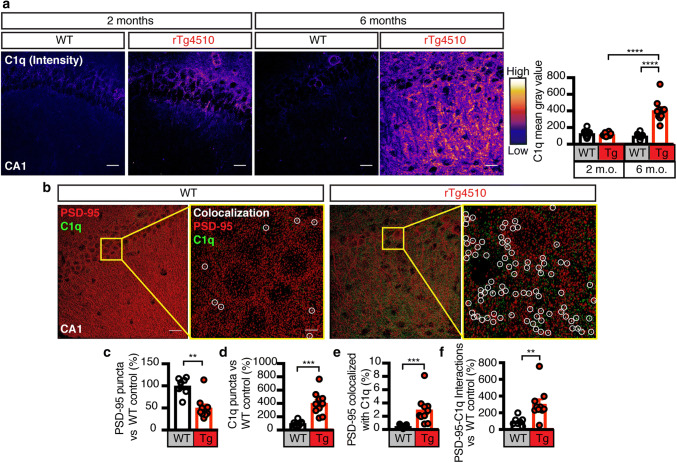
Fig. 2.
Increase of complement factor C1q and its association with PSD-95 in rTg4510 mice. a Representative fluorescence images and analysis for C1q (pseudo-colored from low-blue to high-white) from the CA1 region of 2 and 6-month-old rTg4510 and WT mice. The analysis reveals an increase in C1q intensity between 2 and 6 months in rTg4510 mice and an increase between rTg4510 and WT mice at 6 months. b 3D spots rendering of PSD-95 (red), and C1q (green) from (C) following deconvolution. Zoomed-in images with yellow border display colocalization of PSD-95 and C1q in white (circled). Scale bar: 20 μm; zoomed-in image: 5 μm. c Quantification of the number of PSD-95 puncta in the WT and rTg4510 hippocampus, showing a significant loss in PSD-95 occurring in rTg4510 mice at 6 months of age. d Quantification of C1q puncta between WT and rTg4510 mice, indicating a large increase in the total number of C1q puncta in rTg4510 mice. e Quantification of the fraction of total PSD-95 tagged with C1q, indicating that despite a loss of PSD-95, there is a greater fraction of PSD-95 that is associated with C1q. f Analysis of the number of colocalized PSD-95/C1q puncta demonstrating that in rTg4510 mice more PSD-95 is tagged with the “eat-me” signal C1q. Data presented as mean ± SEM, *p < 0.05, **p < 0.01, ***p < 0.001, ****p < 0.0001; a two-way ANOVA with Tukey’s multiple comparison test, c, d, e, f unpaired t test

