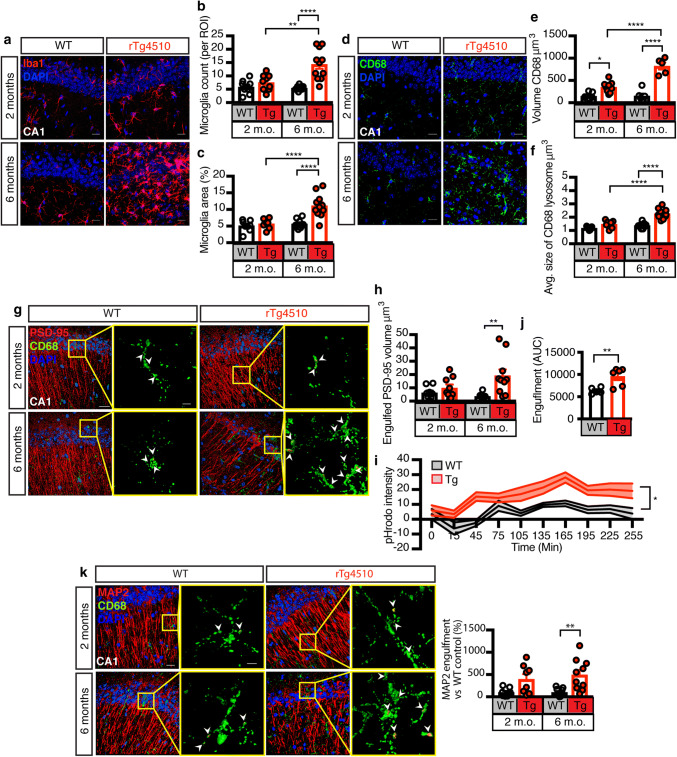
Fig. 3.
Microglia increasingly engulf neurons and synapses in rTg4150 mice. a Representative fluorescence maximum intensity z-projections for the microglial marker Iba1 (red) and the nuclear marker DAPI (blue) in the CA1 region of 2 and 6 month-old WT and rTg4510 mice. Scale bar: 20 μm. b Quantification of microglia per ROI from a, counting DAPI- and Iba1-positive cells. This analysis provides evidence of microgliosis in rTg4510 mice. c Quantification of microglia area per ROI from a, analyzed by thresholding the Iba1 signal. Together with b this analysis provides evidence of microgliosis in rTg4510 mice. d Representative fluorescence maximum intensity z-projections of the microglial lysosomal marker CD68 (green) and DAPI (blue) in the CA1 region of 2 and 6 month-old WT and rTg4510 mice. Scale bar: 20 μm. e Quantification of the volume of CD68 from (D), measured by surface rendering in Imaris. This analysis demonstrates that microglial lysosome production, a proxy for phagocytic activity, is increased in rTg4510 mice. f Quantification of the average volume of individual CD68 lysosomes from (D), measured by surface rendering in Imaris. g 3D rendering of the postsynaptic marker PSD-95 (red), CD68 (green) and DAPI (blue), with arrowheads indicating engulfment. h Quantification of the volume of PSD-95 engulfed by microglia in the hippocampus of 2 and 6 month-old rTg4510 and WT mice. This analysis provides evidence of microglia engulfment of synaptic structures in rTg4510 mice. Scale bar in composite image: 20 μm; scale bar in zoomed-in images: 5 μm. i Time course quantification of synaptosomal engulfment by microglia using the acidification sensor pHrodo-AM red. Data points at each time segment represent individual animals analyzed in triplicates. This analysis demonstrates that synaptosomes from rTg4510 mice are primed for engulfment by microglia. j Quantification of the area under the curve from i, representative of total engulfment. k 3D rendering of the neuronal marker MAP2 (red), CD68 (green) and DAPI (blue), with arrowheads indicating engulfment. Quantification of MAP2 engulfment by microglia in the hippocampus of 2 and 6 month-old rTg4510 and WT mice. This analysis provides evidence of microglia engulfment of neuronal structures in rTg4510 mice. Scale bar in composite image: 20 μm; scale bar in zoomed-in images: 5 μm. Data presented as mean ± SEM, *p < 0.05, **p < 0.01, ****p < 0.0001; b, c, e, f, h, i and k two-way ANOVA with Tukey’s multiple comparison test, j unpaired t test

