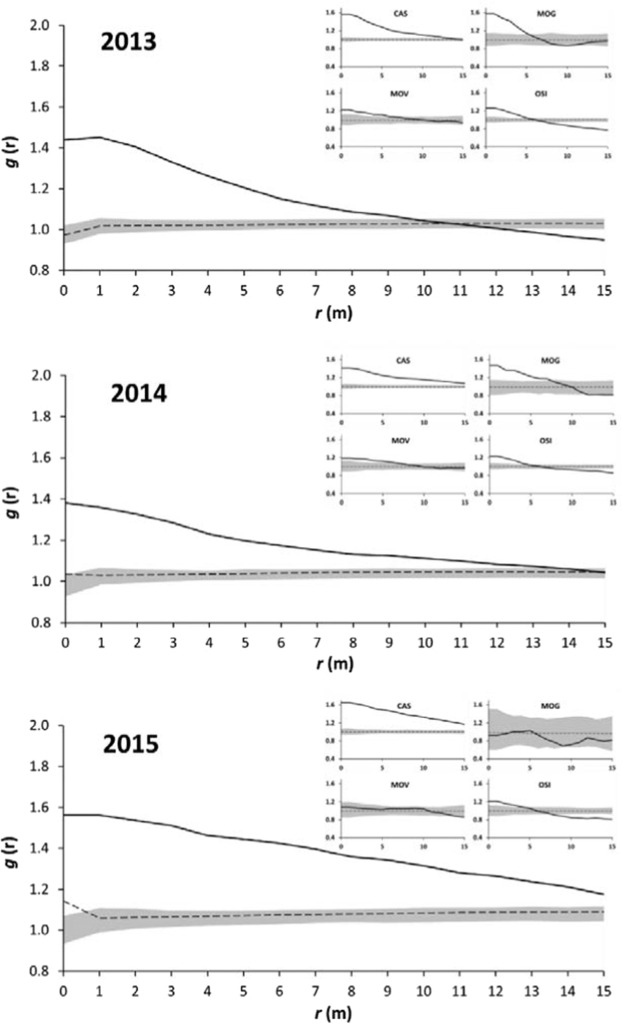
Figure 2.
Univariate PPA of the overall symptomatic plants in the four vineyards of the Marche region using the combined replicates. Bold line, pair-correlation function g(r); dotted line, expected value under the null model (i.e., complete spatial randomness); shaded areas, non-significant (i.e., random) distributions representing 2.5th and 97.5th percentiles for g(r), from 999 Monte Carlo permutations. Insets: Results of each site separately.

