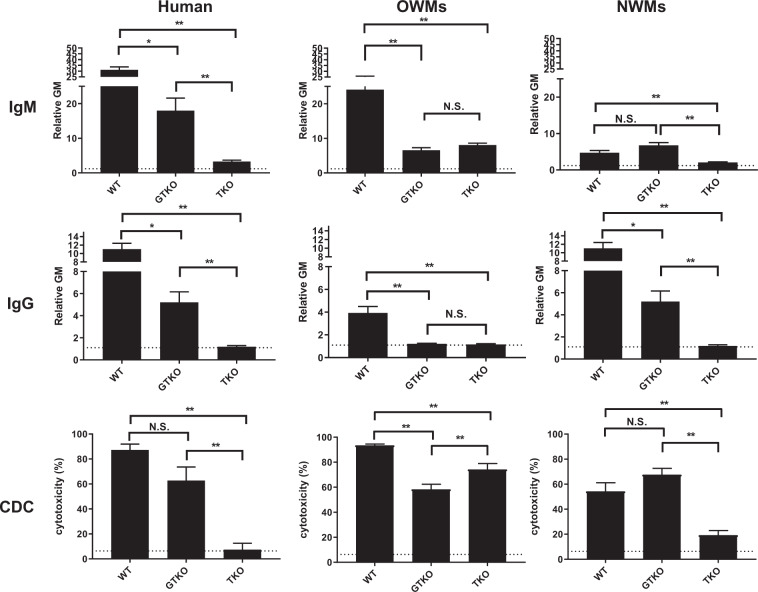
Figure 6.
Human, OWM, and NWM IgM and IgG binding and complement-dependent cytotoxicity (CDC, at 25% serum concentration) to WT, GTKO, and TKO pig PBMCs. Results are expressed as mean ± SEM. (*p < 0.05, **p < 0.01; N.S. = not significant). On the y axis, the dotted line represents cut-off value of binding (relative GM: IgM 1.2, IgG 1.1). For CDC on the y axis, the dotted line represents cut-off value of cytotoxicity (6.4%). (Note the difference in scale on the y axis between IgM and IgG).

