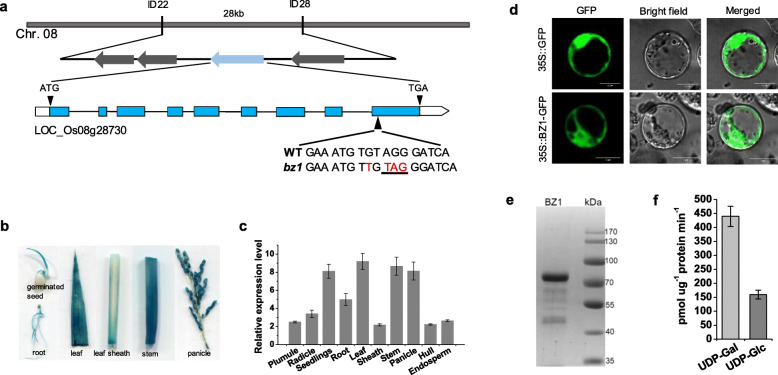
Fig. 2.
Molecular and biochemical identification of BZ1. a Map-based cloning of BZ1. The arrows indicate the candidate genes. The boxes and lines in the diagram of the BZ1 gene indicate exons and introns, respectively. The arrowhead indicates a single base pair insertion (shown in a red-letter) in the last exon inducing a premature translational stop codon (underlined). b GUS activity staining assay in various organs of BZ1pro::GUS transgenic plants. c The expression pattern of BZ1 detected by qRT-PCR. d Observation of BZ1-GFP in rice protoplast. Scale bar, 10 μm. e SDS/PAGE analysis of recombinant OsBZ1 expressed and purified from E. coli. Protein molecular mass standards (in KDa) are indicated on the right. The molecular mass of recombinant BZ1 is larger than the native BZ1 (due to the N-terminal GST tag fusion that facilitates purification). f UDP-Gal and UDP-Glc substrate specificity of recombinant purified BZ1. The error bar indicates SD values (n = 3)

