
FIGURE 1.
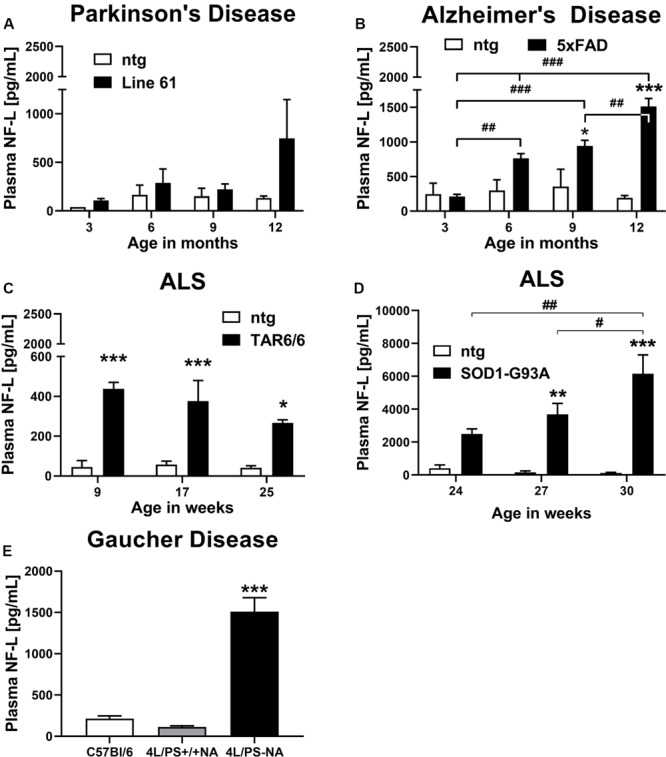
Neurofilament light chain (NF-L) levels in the plasma of different mouse models of neurodegenerative and rare diseases. (A) NF-L levels in the plasma of 3 to 12 month old Line 61 mice as model of Parkinson’s disease; Line 61: n = 4, ntg: n = 2. (B) NF-L levels in the plasma of 3 to 12 month old 5xFAD mice as model of Alzheimer’s disease; 5xFAD: n = 8, ntg: n = 4. (C) NF-L levels in the plasma of 9 to 25 week old TAR6/6 mice (TDP-43) as model of Amyotrophic lateral sclerosis; TAR6/6: n = 6, ntg: n = 5. (D) NF-L levels in the plasma of 24 to 30 week old SOD1-G93A low expressor mice as model of Amyotrophic lateral sclerosis; SOD1-G93A: n = 6–7, ntg: n = 6–7; (A–D): Two-way ANOVA with Bonferroni’s post hoc test. *differences between genotypes; #differences between age groups. (E) NF-L levels in the plasma of 18 week old 4L/PS-NA mice as model of Gaucher disease; 4L/PS-NA: n = 7, 4L/PS+/+NA: n = 7, and C57Bl/6: n = 7; One-way ANOVA with Tukey’s multiple comparison test. Significance compared to 4L/PS+/+NA littermates and C57Bl/6 mice; (A–E): Mean + SEM. *p < 0.05, **p < 0.01, and ***p < 0.001.