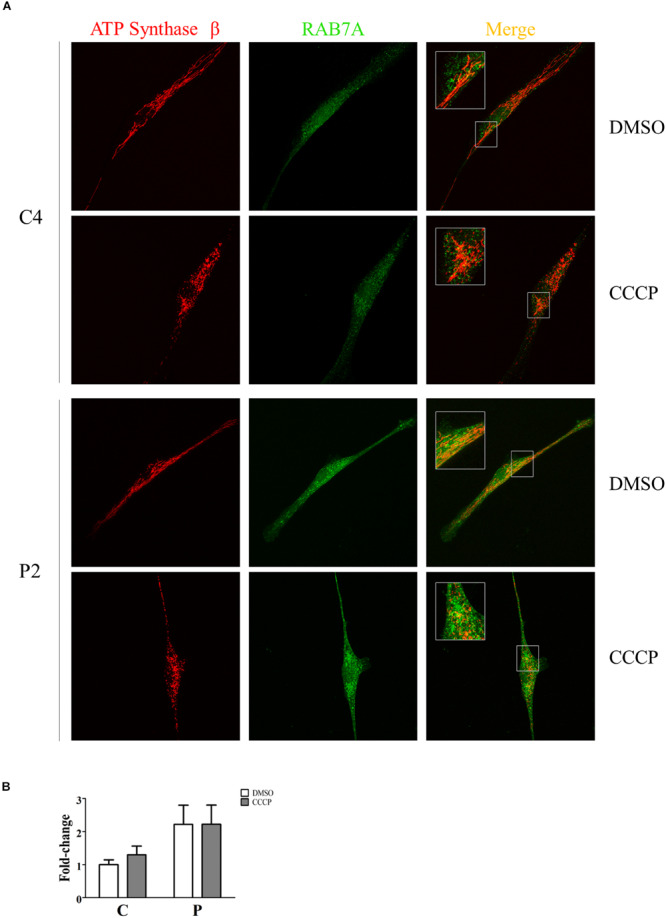
FIGURE 10.

Rab7A was recruited to mitochondria in PARK2 patients. (A) Representative images of ATP synthase β (mitochondrial area) and Rab7A (quantification) signals from one control subject (C4) and one PARK2-mutated patient (P2) after DMSO or CCCP treatment. The merge panel shows the juxtaposition of the two signals. Insets show the magnification (165%) of details in squares. (B) Quantification of Rab7A signal per mitochondrial surface unit. Data were expressed as mean ± SEM. Statistical analysis was performed by two-way ANOVA, to assess the effect of “mutation” (control subjects vs. PARK2 patients), “treatment” (DMSO vs. CCCP), and “interaction.” “Treatment” (p = 0.74; F = 0.12) and “interaction” (p = 0.74; F = 0.11) did not result to be significant sources of variation. “Mutation” (p = 0.04; F = 5.97) resulted to be a significant source of variation.
