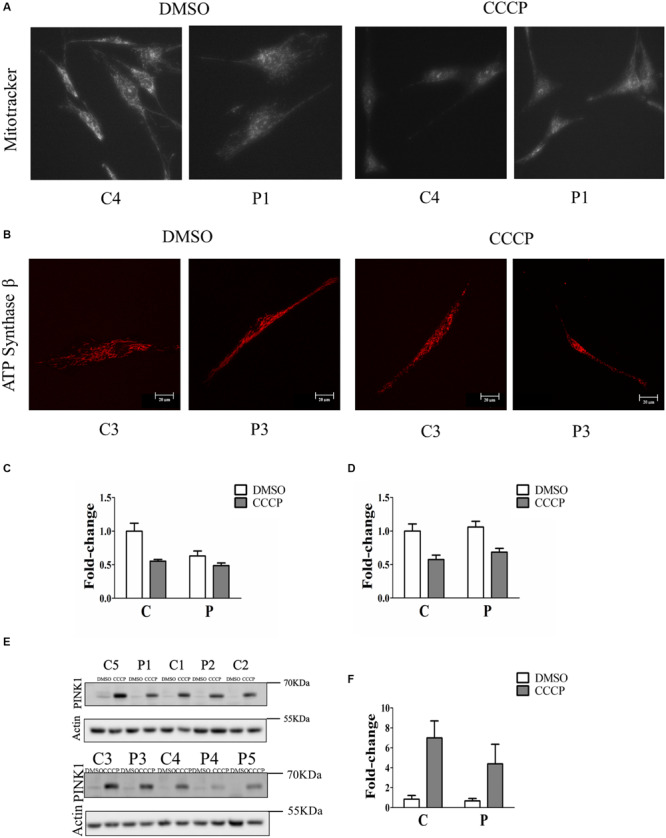
FIGURE 2.

Mitochondrial depolarization without PINK1 protein accumulation in PARK2- mutated patients. (A) Representative images of fibroblast cells from one control subjects (C4) and one PARK2-mutated patient (P1) stained with Mitotracker Red CMXRos after DMSO or CCCP treatment. (B) Representative images of fibroblast cells from one control subjects (C3) and one PARK2-mutated patient (P3) stained with anti ATP Synthase β after DMSO or CCCP treatment. (C) Quantification of Mitotracker Red CMXRos fluorescence normalized by the number of cells. Data, expressed as mean ± SEM, were analyzed by two-way ANOVA, to assess the effect of “mutation,” “treatment,” and “interaction.” “Mutation” (p = 0.009; F = 9.0) and “treatment” (p = 0.001; F = 16.2) resulted to be significant sources of variation. (D) Quantification of anti ATP Synthase beta fluorescence normalized by cell surface. Data, expressed as mean ± SEM, were analyzed by two-way ANOVA. “Treatment” (p = 0.001; F = 24.8) resulted to be a significant source of variation. (E) Representative western blot image of PINK1 protein after DMSO (control) or CCCP treatment in primary skin fibroblasts of PARK2-mutated patients (P) and control subjects (C). (F) Relative fold-change of PINK1 protein in both control subjects and PARK2-mutated patients after CCCP treatment. Data were expressed as mean ± SEM (three technical replicates). Statistical analysis was performed by two-way ANOVA. “Mutation” (p = 0.0001; F = 210.9), “treatment” (p = 0.0001; F = 16.92), and “interaction” (p = 0.0007; F = 12.75) resulted to be significant sources of variation. “Mutation” = control subjects vs. PARK2-mutated patients, “treatment” = DMSO vs. CCCP.
