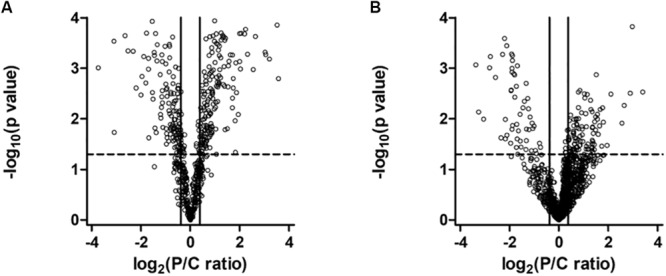
FIGURE 5.

Volcano plot of proteins in the mitochondrial (A) and in the whole cell (B) fractions. Dots represent proteins, distributed by fold change along the x-axis and by p-value along the y-axis. Proteins with a statistically significant differential expression are located in the top right (up-regulated) and top left (down-regulated) quadrants.
