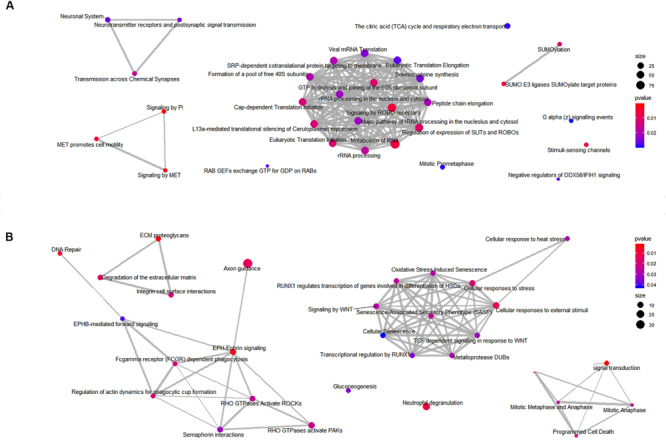
FIGURE 9.

Enriched classes of proteins found using a GSEA approach. Enriched map of GSEA results for the mitochondrial (A) and the total (B) fractions. Color coding represents significance of the gene set for the dataset. Node size correspond to the number of genes from the reference set that are part of the gene set.
