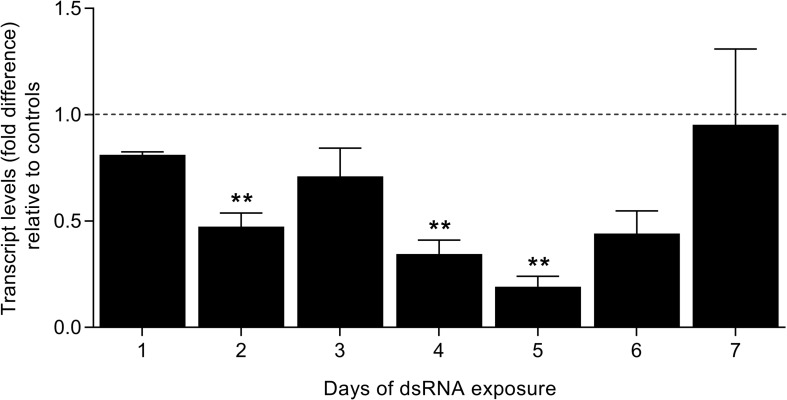
FIGURE 2.
Evaluation of SmFES transcript levels in schistosomula exposed to SmFES-dsRNA for 7 days. Bar graph representing the mean of SmFES transcript levels in schistosomula exposed to SmFES-dsRNA for 7 days. The dotted line represents normalized SmFES transcript levels in parasites exposed to green fluorescent protein (GFP)-dsRNA and in the untreated control. Error bars are represented above the bars. Statistical analysis using Mann–Whitney test is represented with asterisks above the bars (**P < 0.01).

