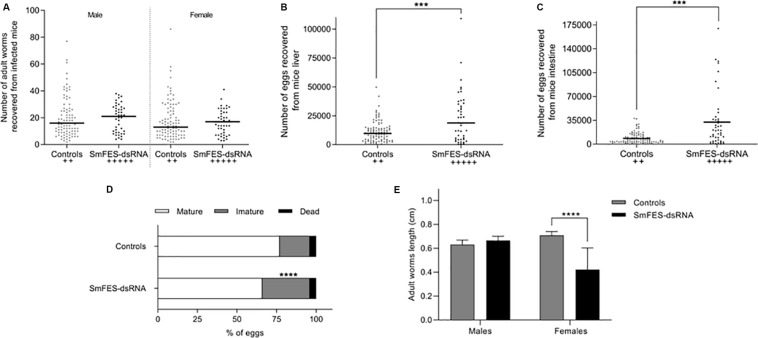
FIGURE 4.
Schistosomula Smfes knockdown effects after mammalian infection. Dispersion graph representing the number of adult worms males (left) and females (right) (A) and eggs from the liver (B) and intestine (C) recovered from mice after 42 days of infection with schistosomula from untreated and green fluorescent protein (GFP) control groups (controls, gray) or exposed to SmFES-dsRNA (black) for 3 days. Each dot represents the number of worms/eggs recovered from one mouse. Median is represented by the horizontal black line. Statistical analysis using unpaired t-test with Welch’s correction is represented with asterisks (***P < 0.001). The cross symbols represent dead mice. (D) Bar graph representing the percentage of mature (white), immature (gray), and dead (black) eggs in the mice ileum after 42 days of infection. Statistical analysis of immature egg numbers using Mann–Whitney test is represented with asterisks above the bars (****P < 0.0001). (E) Bar graph representing the median length of adult worms recovered from mice infected with schistosomula from control groups (gray bar) or Smfes-knocked-down schistosomula (black bar). Above the bars are represented the 95% confidence interval. Statistical analysis using Mann–Whitney test is represented with asterisks (****P < 0.0001).

