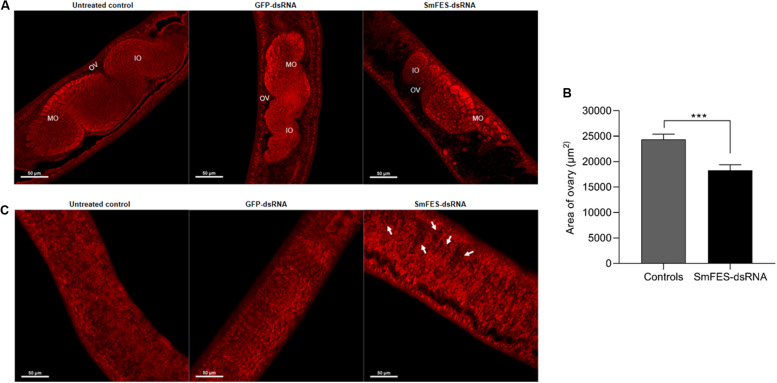
FIGURE 6.
Analysis of ovary and vitellarium of females recovered from mice infected with Smfes-knocked-down schistosomula. (A) Representative confocal images showing the ovary of females recovered from mice infected with schistosomula from untreated control or exposed to green fluorescent protein (GFP)- or SmFES-dsRNAs for 3 days. White bars indicate 50 μm. Abbreviations: OV, ovary; IO, immature oocyte; MO: mature oocyte. (B) Bar graph representing the median area of females’ ovary recovered from mice infected with schistosomula from control groups (gray bar) or Smfes-knocked-down schistosomula (black bar). Above the bars are represented the 95% confidence interval. Statistical analysis using Mann–Whitney test is represented with asterisks (***P < 0.001). (C) Representative confocal images showing the vitellarium of females recovered from mice infected with schistosomula from untreated control or exposed to GFP- or SmFES-dsRNAs for 3 days. Arrows show the holes in the vitellarium, and white bars indicate 50 μm.

