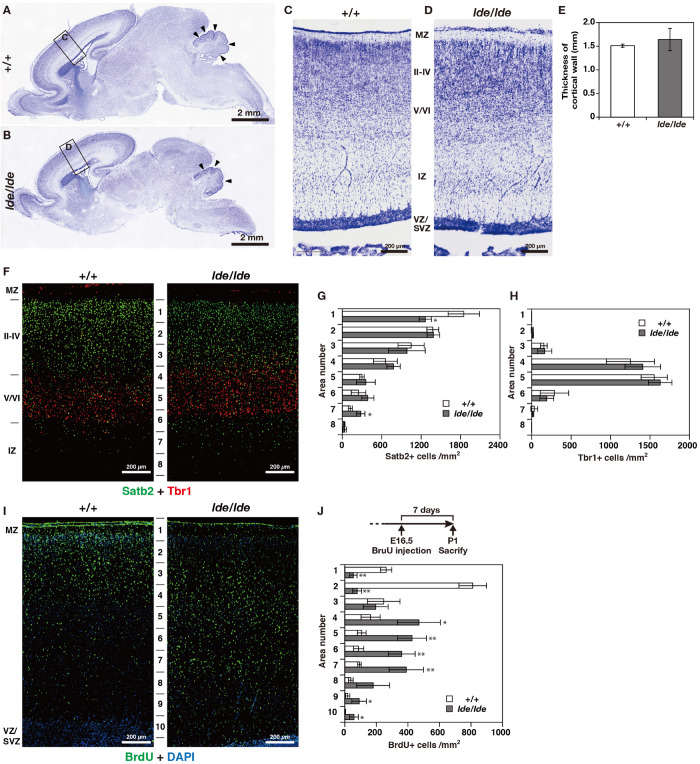
FIGURE 3.
Cortical layer formation and neural migration in lde/lde rat brain compared to normal one. (A–D) Sagittal brain sections at P1 rats were subjected to Nissl staining. Squares as labeled C and D in panels (A,B) indicated identical areas as shown in panels (C,D), respectively. Arrowheads indicate delayed foliation in lde/lde cerebellum. (E) The thicknesses of cerebral wall (MZ to VZ/SVZ) is shown as mean ± S.D. from three independent experiments. Student’s t-test is used to determine statistical significance (∗p < 0.05). (F) Sections are co-immunostained with anti-Satb2 (green) anti-Tbr1 (red). (I) Distribution of migrating neuronal cells labeled with BrdU (green) in cerebral cortex. Nuclei are counterstained with DAPI (blue). Representative images from three independent experiments are shown. The cell densities of Satb2 (G), Tbr1 (H), and BrdU-positive cells (J) in each area are plotted as histograms. Values are shown as the mean ± SD. The asterisk indicates a significant difference between +/+ and lde/lde in the same area by Student’s t-test (∗p < 0.05, ∗∗p < 0.01). Experimental scheme to label migrating cells by BrdU is illustrated in panel (J). MZ, marginal zone; IZ, intermediate zone; VZ, ventricular zone: SVZ, subventricular zone.

