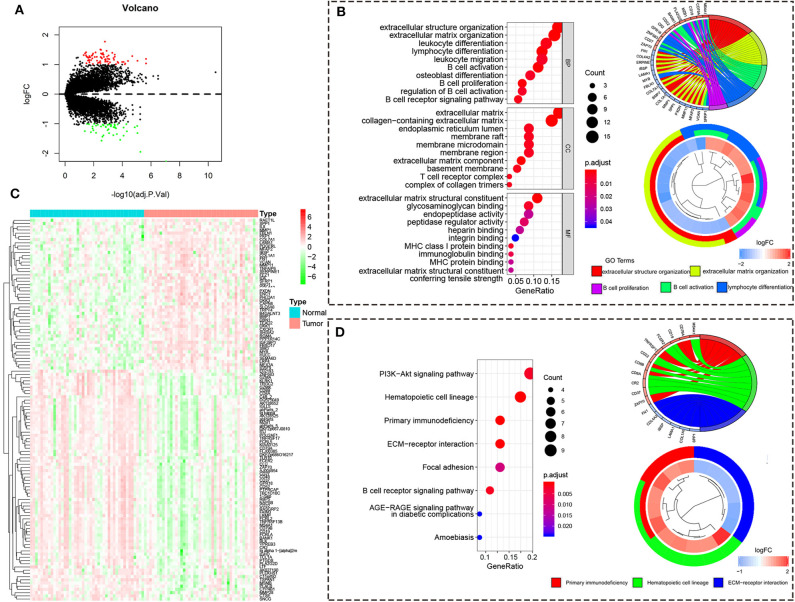
Figure 5.
The differentially expressed gene from the high/low-risk group. (A) The volcano map of DEGs from the high/low-risk group. Red means upregulated genes, and blue means downregulated genes. (B) The heatmap of DEGs from the high/low-risk group. (C) The GO analysis of DEGs. (D) The KEGG analysis of DEGs.

