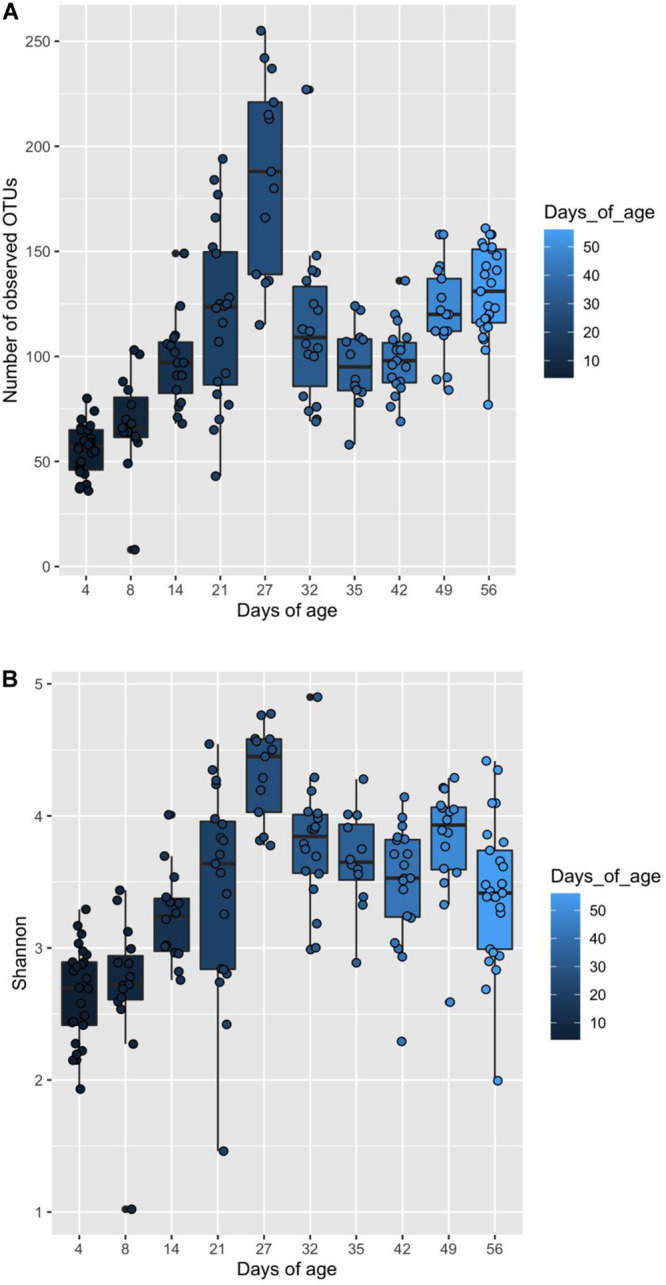
FIGURE 4.

Box and whisker plot demonstrating (A) the changes in observed OTUs, and (B) Shannon diversity associated with increasing piglet age. (A) Significant differences in observed OTUs associated with piglet age are identified by differences in the assigned Tukey HSD letters: days 4a, 8b,14c, 21d, 27f, 32d, 35c, 42c, 49d and 56e. (B) Significant differences in Shannon indices associated with piglet age are identified by differences in the assigned Tukey HSD letters: days 4a, 8ab,14bc, 21cd, 27e, 32d, 35cd, 42cd, 49d and 56cd.
