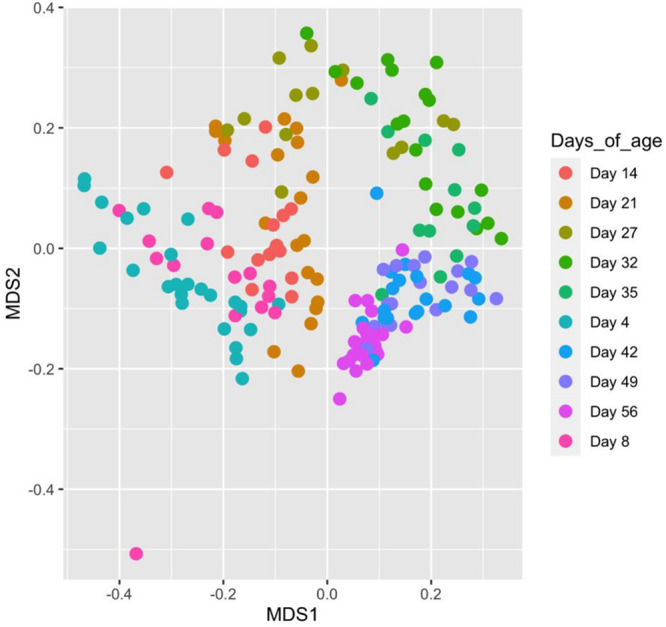
FIGURE 5.

MDS plot showing changes in, and the relatedness of, faecal microbiota community composition with sample age calculated using Bray–Curtis distances. Points on the plot represent individual piglet samples which are positioned on the plot based on their similarity to other communities in two-dimensional space. Points more closely clustered represent microbiota communities more closely related to one another based on taxa composition and abundance.
