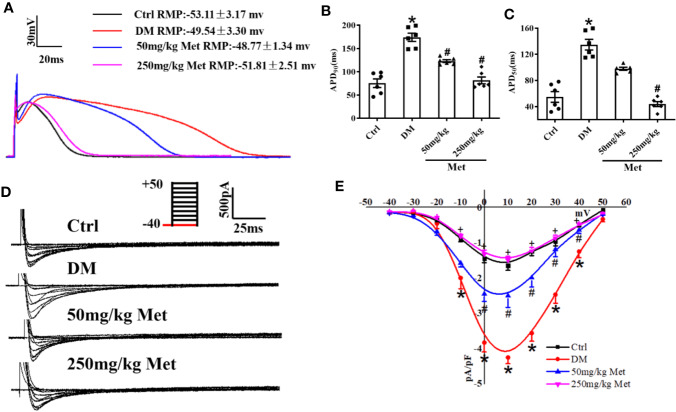
Figure 2.
The effect of metformin on APD and ICa-L in cardiomyocytes isolated from diabetic mice. (A) Representative action potential traces in the Ctrl group, DM group, and the metformin-treatment group. (B) Relative levels of APD90 in the Ctrl group, DM group, and the metformin-treatment group. (C) Relative levels of APD50 with metformin in the Ctrl group, DM group, and the metformin-treatment group. (D) Representative ICa-L traces in the Ctrl group, DM group, and the metformin-treatment group. The holding potential was -40mV. (E) I-V curves of ICa-L in the Ctrl group, DM group, and the metformin-treatment group. Values represent mean ± SEM, nCtrl = nDM = nMetformin = 6. *P < 0.05 versus Ctrl, #P < 0.05 versus DM.

