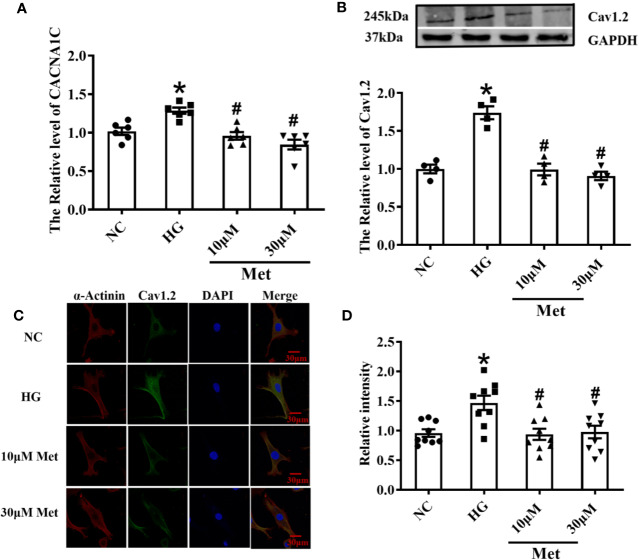
Figure 5.
Treatment effects of metformin on the mRNA and protein levels of Cav1.2 in primary cultured neonatal mice cardiomyocytes. (A) Relative levels of CACNA1C with metformin of primary cardiomyocytes in NC group, HG group and metformin-treatment group detected by real-time PCR, n=6. (B) Relative levels of Cav1.2 of primary cardiomyocytes in NC group, HG group and metformin-treatment group detected by western blot, n=6. (C) Representative confocal images of α-Actinin (left) or CaV1.2 (middle) of primary cardiomyocytes in NC group, HG group and metformin-treatment group. (D) Relative levels of Cav1.2 of primary cardiomyocytes in NC group, HG group and metformin-treatment group detected by immunofluorescences, n=9. Values represent mean ± SEM, *P < 0.05 versus NC, #P < 0.05 versus HG.

