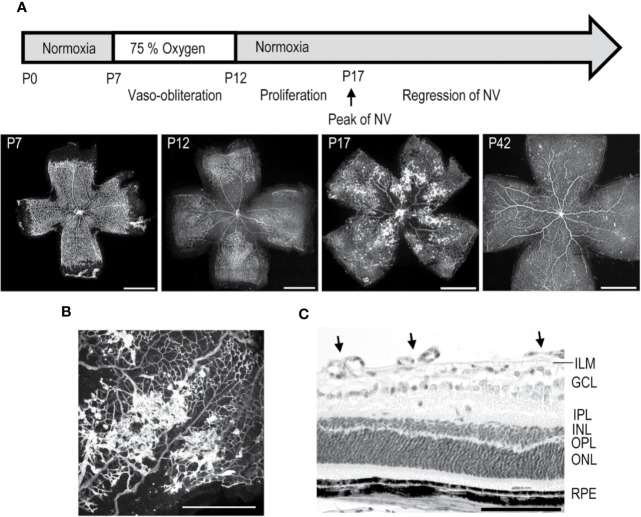
Figure 3.
Mouse oxygen-induced retinopathy model. (A) Timeline of the OIR model. Induction; mice are exposed to 75% oxygen from P7 to P12 in hyperoxia chamber and returned to normal room air. Avascular area in the central retina (at P12) induces revascularization, and peak of preretinal NV is seen at P17. (B) Preretinal neovascular tufts form at the border between the vascular and avascular retina. (C) Retinal cross-section of OIR retina at P17, where preretinal tufts are sprouting towards the vitreous. Moreover, thinning of INL and OPL layers is seen. Scale bars are 1 mm in A, 500 µm in B, and 100 µm in C. This figure is reproduced from Vähätupa, 2019 with the permission of the copyright holder.

