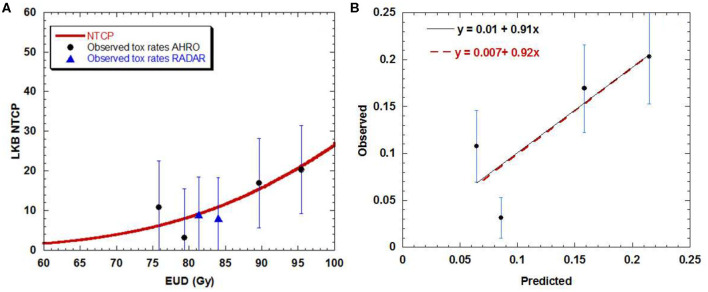
Figure 2.
(A) Dose-volume response curve obtained with the best estimated parameters for the LKB model for urethral stricture. Solid black circles represent the AHRO observed toxicity rates with corresponding error. The blues triangles represent the RADAR patients. (B) Calibration (predicted vs. observed) curves obtained by using the AHRO LKB model and data (red dotted line, apparent calibration line; black continuous line, calibration line after correction for optimism).

