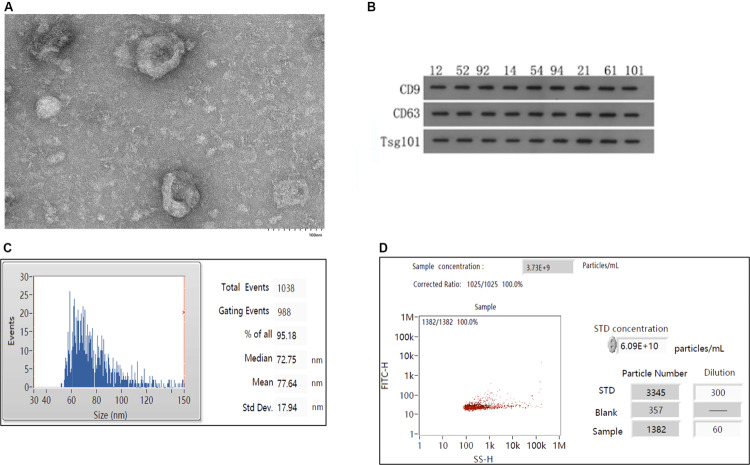
FIGURE 1.
Isolation and characterization of exosomes. (A) Electron mirror diagram of exosome extraction. (B) Results of western blotting of serum exosomal samples (n = 9). Numbers marked on the strip indicate randomly selected samples. (C) Analysis of particle sizes of exosomes. (D) Analysis of exosomal concentrations.

